|
Please be fair to the author. Pay your Shareware fee HERE, and receive the CD-ROM at no extra cost. |
||||||||||||||||||
|
COMPUTER AIDED PETROPHYSICAL ANALYSIS
I had also included Chapters on calculator programs and spreadsheet analysis of logs. At the time, the programmable scientific calculator was only 10 years old and economical versions were only 4 years old. Spreadsheets were 4 years old, but memory and software limitations were quite severe. Calculator and spreadsheet use are now so ubiquitous that we no longer have to teach people about their detailed operation. I personally pioneered a desktop log analysis software/hardware system in 1976 based on HP 9800 series personal computers, 5 years before IBM "invented" the PC. Later, I pioneered the use of spreadsheet software for log analysis in 1984 on Lotus 1-2-3, before Microsoft Excel even existed. These packages were sold world wide as LOG/MATE and MINI/MATE (later upgraded to become META/LOG) respectively. I mention this not to brag, but to illustrate that there is not much really new under the sun, merely faster, and more capable of handling large data sets. Most of the current software still uses the same equations that we used in 1976.
I also worked on artificial intelligence (expert systems) for petrophysical analysis from 1984 to 1986. Initially called LOG/MATE ESP, this research culminated in a software package called INTELLOG. Unfortunately, it has not been supported for many years and expert systems in general have lost their allure in favour of interactive graphics, deterministic models, and probabilistic software code. If you are interested in this ancient history, right click the highlighted links to download the PDF file of the original papers. Over the years, I have contributed code or advice on more than 20 software packages. I continue to contribute mentoring advice on appropriate equation sets for users of commercial software packages, many of which arrive pretty "naked" or too "Gulf Coast" for use elsewhere. With this background exposed, I offer below a review of the problem of choosing petrophysical software and a series of question you should ask if you are assigned with the task of evaluating petrophysical analysis software, either for your own use or for your employer. No tradenames are used or endorsed.
The dilemmas posed by this situation are: 1. New applicants for such positions are relatively inexperienced, or replace people who are more experienced. 2. The urgent need for answers reduces the time the analyst has to spend on each project, thus reducing analysis quality, thoroughness, and consistency. 3.
Most companies don't have an organizational infrastructure to
support petrophysical analysis 4. The gurus have retired, died, or cost $220 per hour as consultants. The usual solution is to provide the analyst access to a computer with log analysis software, or to a logging service company or computer service bureau who have log analysis programs. The rationale is that the professional can get more done, more consistently, than by chartbook, hand-calculator methods, or over-simplified Excel spreadsheets. Unfortunately, the expected improvement in performance or results is seldom met, as many have found from first-hand experience. To evaluate the success of a computer augmented log evaluation system, we must ask the following questions: 1. Does the system (analyst plus computer plus program) get more, better, and faster answers than some other method? 2. Even if it does all the above, is the system support cost reasonable (computer, systems analysts, programmers, computer operators, technical assistants, data preparation)? 3. Is the organizational cost low enough (supervisor, clerical, filing, data gathering, computer access)? 4. Do you get answers when you need them (current wells now, reserves reports or large projects by fixed deadline)? 5. Is the professional analyst in a reasonably attractive work environment and career path (if not, he'll leave or do poor work)? The five criteria mentioned above are especially pertinent to large projects; that is, log evaluation of many zones related by area or formation. This is true because large projects usually serve, or contribute to some important corporate goals, or are part of some submission to a regulatory agency. If petrophysical results are inadequate, or cannot be developed in time to meet decision making or filing deadlines, then severe competitive or financial penalties may be incurred. There are a number of general areas in which
petrophysical projects
may occur. These may be categorized by reference to the "Resource
Triangle" shown below, in which the known, proved
reserves are contained within a small area at the top of the triangle.
This classification of resource is usually the domain of the production,
exploitation, or utilization department of the oil or gas company.
Development of this resource generates most of the positive cash flow for the company, from which exploration activity can be funded. As a result, this is the resource which needs the best documentation, such as reserves and productivity estimates, and is required by banks, regulatory agencies, and corporate management. Well log analysis for this purpose could encompass a review of every completed zone in which the company has an interest. This must be properly organized from inception of production, since an enormous log analysis project may result when management or government decides to request this data. These projects are often called pool studies, unitization studies, or reserves studies. Because several geoscience disciplines are usually needed to complete these studies, they are often called integrated projects. An alternative and faster method of determining proved reserves is decline curve analysis. However, this approach is unsatisfactory with increases in petroleum demand and prices. It reflects historical production trends or techniques, and does not address the problem of recovering additional oil or gas from the existing resource base. Log analysis does not necessarily tell you how to recover more, but at least tells you where more might be located. A second class of log analysis project involves exploration oriented decisions. Such projects usually include data from all or most wells in a specific block or tract of acreage. The object is to identify the second tier of the resource triangle - the unproven but promising leads found during previous drilling operations. These projects are often termed exploration or play development projects. Large amounts of oil, and especially gas, were by-passed when prices were low. Therefore, there is a relatively large reserve in the "probable" category, waiting for the exploration department, and the petrophysicist, to define.
If data and result bases are lacking, decisions are made with minimal information, resulting in a poor overall success ratio on lease acquisition and drilling. The third class of petrophysical project involves more work defining reservoir quality and prospects, rather than proving up previous hydrocarbon shows. The log analyst's tasks are similar, but he may spend more time defining water bearing reservoirs, to provide the geophysicist and geologist with data on potential reservoir conditions. We call these projects reconnaissance or review projects. They are extensions or part of exploration or development projects. Input from the geophysical and geological departments, and the log analyst, will ultimately define drilling locations for true wildcat wells, as opposed to step-out or offset wells to proved or probable production. These wells will finally define the limits to the bottom, potential, portion of the resource triangle. Many tight gas sands in North America have started shifting from potential to probable reserves, and in many cases have moved into the proved category. The economics of large well stimulation treatments will be the most significant factor in moving more of this resource across the boundary into the proven category, since few now doubt that the resource is at least in the ground. The fourth class of the petrophysical project is the day to day evaluation of current drilling wells in which the company has an interest. If done consistently, this work significantly reduces the effort needed to evaluate data in the three categories previously described.
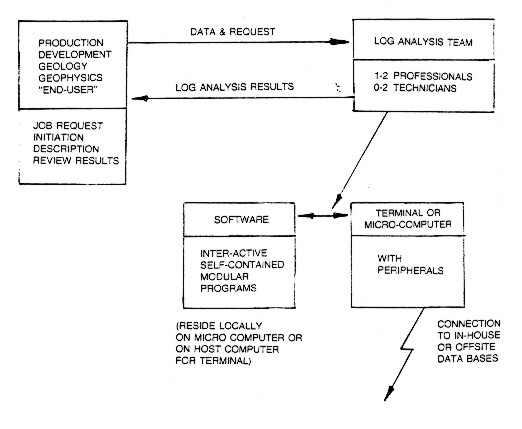
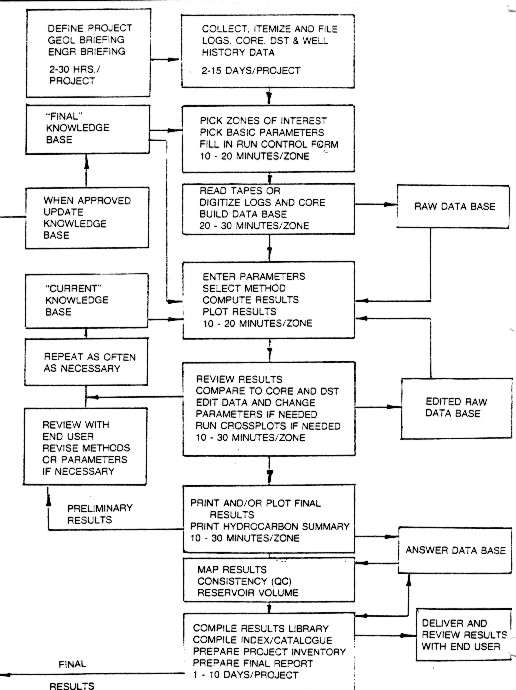
The interconnecting links in the system are its most important feature. Good communication must exist, along with mutual trust and understanding, between the "user" (the engineer, geologist or geophysicist) and the "doer" (the petrophysicist). The analyst in turn, must effectively communicate with the computer hardware-software package and staff. A good system must be built around a team concept, consisting of the lead or senior petrophysicist, a junior or trainee analyst, up to two technicians, and possibly a clerk/technologist. Some of these people are shared or "float" to projects as needed. The senior analyst is responsible for project definition, parameter and method selection, difficult editing, work scheduling and organization, review of intermediate and final results, presentation and discussion of final results with the end-user, and training and work allocation of subordinates. He must have a thorough knowledge of log analysis methods, and be aware of all the available features on the hardware / software package. He can run the package effectively after a few days exposure to it and can modify programs to suit special cases or local requirements. The more junior members of the team run the package under the direction of the analyst. and perform the many clerical tasks involved in organizing and filing large volumes of data. These people must be keen and adept in the use of computers. Log analysis should be performed on a definable zone - not on an entire well at once. As many zones as needed are run to cover all potential pay sections. The entire well may be analyzed, but as a series of discrete zones. A run control sheet is used to describe the zones to analyze, the data available, the computation method, and parameters required, as well as a brief well history to aid the analyst. The well history is also annotated on the final results to aid discussion and understanding of the log analysis by others. On large projects, a group of 5 to 10 related zones, preferably cored and tested, will be picked, digitized, and computed as a "batch". These are reviewed, parameters adjusted as needed, recomputed, reviewed again and eventually finalized. In the earlier stages of a large project, the batches consist of those zones with the most core and DST data available. These zones are used to calibrate log analysis parameters before un-cored zones are analyzed. The organization of this procedure and the data bases required are illustrated in the block diagram below.
These stages may seem simple, even trivial or obvious, but clear definitions benefit the end-user and the analytical team, not to mention management, who may have no idea how petrophysics is really done. Large projects or continuous, on-going projects slow down if the job stream or data structure is unorganized or chaotic. The two feedback loops shown above indicate that successive re-runs to optimize methods or parameters are easy, rapid, normal, and probably necessary. This is the key to satisfying both the technician and the professional analyst, because individual zones are usually finished completely in just a few elapsed hours instead of days or weeks. A reasonable number of zones (5-20) may be interleaved, so that different functions are performed on different zones. This is a natural outcome of the variable number of times the zone has to be re-computed. In smaller organizations, the analysis team may be one person, and in some instances, the team and the end-user may be the same person. This does not change the need to organize and review data and results. Other organizations use a dispersed or distributed systems approach, in which the end-user, or their technical staff, do their own log analysis. This may be successful if training and standards are excellent, and specialists are available for certain jobs and for training.
1.
batch computer - now obsolete These modes define the hardware type, not the brand name, that the log analysis team sees in their environment. There are alternative sources of the computing service, namely: 1.
in-house The hardware/software training/support package for in-house systems are available from: 1.
in-house These categories further refine which hardware components are required at the analyst's site. For example, you may require only a terminal and printer to use a service bureau package, or no hardware to use a consulting service. However, the consulting service's hardware will influence turn around time, price, or visual quality of your results. The mode of operation and types of hardware will affect your ability to control the numerical quality of your results, since you may or may not have control over the methods (models) or parameters used in the analysis. The word "interactive" has come into common use, with respect to interactive graphics. True interactive graphics allow the user to modify the data presented on the graphics screen (CRT), by altering scales, data values, or annotation by commands from the keyboard or function keys. Today, it refers to the ability to move a cursor or mouse to define, select, or alter points on the screen. Some descriptive literature uses the term interactive to describe graphics that can be displayed on the screen, under user control, but without the ability to change the picture once it appears, unless the program is run over again. The term is often miss-used to indicate any terminal or desktop computer with a keyboard, with which a user could interact with the program. Stand alone desktop systems are inexpensive and powerful enough to perform most or all of the analysis and data handling in the analyst's work area. This reduces time conflicts with other computer system users, puts more control in the hands of the analyst and usually reduces cost and turn around time. Computer department management may perceive this approach as dissolving their department's function. This can be minimized by involving the systems group in all phases of planning and installation. Most stand alone systems can communicate via telephone lines to large computers, thus relieving the systems group's concern over isolated, unconnected hardware.
Some computers do have more user-friendly features than others, such as user or program defined function keys, touch sensitivity screens, or light pens. These features are desirable in a software package, but are of minimal importance in the overall operation of the system. Operating systems and programming languages should be selected for suitability, and updating capabilities, not for preconceived benefits or faults which may be only the purchaser's personal feelings. The software package can be broken down into a number of component parts, namely: 1. data management Approximately 10 percent of the entire software package is used by the log analysis program. The remaining 90 percent is used for data management, input and output, plotting, and printing. These functions are as complicated as the log analysis function and attention here will improve user-friendliness.
1.
Data Management b.
Can you define c.
Can the run stream and/or job control information be d.
Is the file structure
e.
Is the data compacted f.
Can the data be catalogued g.
Is the trace (depth dependent) data h.
Can trace data be stored i.
Are trace names j.
Are files, (projects, batches, single wells) created (opened) k.
Are files (projects, batches, single wells) easily l.
Is trace data stored in m.
Can data be n.
Can the catalogue provide
b. What brands of tape drive can the system handle? c.
Are digitizer modes switched d. What magnetic tape formats can be read, any restrictions (depth increment, age)? e. What type of formats can the system write out, any restrictions? f.
What steps are needed to set up a digitized interval: g. Can the log be spaced up by redefining origin? h. How much data is saved in memory before going to the disc? (in other words, how much can you lose if something goes wrong) i. How fast can the cursor be moved? j. Is data range limit checked on the fly, or after digitizing, or not at all? k. Can you exit digitizer mode easily, correct mistakes easily, back up, rest or answer the phone without starting over? l. Is data taken only at fixed intervals, or fixed times and interpolated? m. Can the system digitize non-log data (e.g. maps, seismic data, core data, mud log data)? n. Can the system read core or log data from PC-DOS floppy discs, from ASCII or other interchange format files?
b.
Can edits be done from c. Can the same edit be applied to more than one trace without further data entry (e.g. depth shifts)? d.
Can the edit sequence be saved e. Is depth shifting or rescaling interactive on the CRT? f.
Are original or edited traces saved g. Can shifted data be re-shifted or un-shifted? h. Are these functions easy to use, with minimum potential for error? i. Can curves be shifted (but not rescaled), to create visual overlays, by interactive CRT? j. Can edits be done over selected intervals of each curve?
b.
Is track layout c.
Can traces d.
Are standard log presentations e.
Are log headers f.
Can curves be shaded g.
Is background grid h.
Can the plot be annotated
j. What plotter brand names and models are available with this software? k. Are they pen type, printer type, or electrostatic plotters? l. What colours are available? Are wide and narrow widths available? m. Can the plot be previewed on the CRT, in colour or black and white? n. Can the CRT plot be dumped to the printer (in black and white or colour)? o. Can the CRT image be scrolled up and down to view more than one log? p. Is the printer the main output? If so, is it dot matrix quality or a character plot? Does it have a colour option? q.
Can the plot presentation description be r.
Are CRT and printer plots at convenient, conventional scales?
Are the characters s. Will the plotter handle transparencies, odd scales or sizes for report generation? t.
Can the system handle English and/or Metric log scales u. Can core data be plotted on top of log data, mud log data or pressure data? v.
Can the vertical scale be any of w. Can plots be spooled to a high speed plotter, either local or remote to the work station?
b. Can the user define which columns to print (as in plot program)? c.
Can the user define print increment d.
Are summary pages e.
Is printed data precision f.
Can the system print g. Are cutoffs applied at print time or with prior program module? h. Can any other discriminators be applied or are they fixed by program? i. What brand names and models of printers are supported? j. How many print columns are absolutely required? How many are desirable? k. Are print pages report size (8 1/2 X 11 inches) or larger? Do they need to be photocopied for permanence (e.g. thermal paper) or reduced in size? l. Do the characters appear well formed with true descenders and ascenders? m. Is net pay interval automatically flagged and summarized? Can non-pay be dropped from listing automatically? n. Can you custom-function columns (e.g. like EXCEL or LOTUS 1-2-3) to obtain new results? o. Can printer output be spooled to a high speed printer, either local or remote from the workstation? p.
Can both subsea and KB depths be printed?
6.
Crossplotting b.
Can you plot c.
Are appropriate scales d. Are axes labeled neatly and correctly with curve abbreviations, full names, and units? e. Are appropriate background grids, lithology lines, and pure mineral points, or other notation provided automatically? Can this data be added to the system by the user? f. Can you annotate comments or line segments on the plot? g. Can you interactively select interpretation parameters on the CRT? And annotate these picks on the plot when chosen? Does plot have a current value shown for easy parameter normally picked from such plots? h. Can you move a cursor about the plot by knob, keyboard, joystick, mouse, digitizer? i.
Can you get j.
What statistics are available k. Are CRT and printer plots drawn or printer character plots? l. Can plots be previewed on the CRT and dumped on the printer? In colour? Can more than one well be plotted on the CRT and shifted to find normalization parameter? m. Can plots be shrunk or expanded to fit reports? Can they be put on transparencies for display? n. Can you plot core data versus log data, mud log data, pressure data, etc? o.
Can plot request be p. Are commonly used plots easy to set up or automatic? q. Can groups of different plots be batched to speed up work? Can the batch description be saved, modified, corrected or revised? r. Can data be dropped from the discriminated plot to remove unwanted noise, bad hole effects, or background in any or all axes? s. Can all axis be functioned at plot time?
b. Can summaries be merged, summed, compared, edited, commented? c. Is data converted to engineering or geological terms when necessary? d. Can cash flow or exploration economics be calculated? e. Can English and Metric data be merged, mixed or presented in both systems of units.
b. Is report generation solely controlled by the user, or are conclusions drawn from the data and converted to English sentences? c. Do canned report phrases sound reasonable? Can they be modified for each user need? d.
Does the final report integrate tabular printed data, graphics
and text into a e.
Can reports be saved, updated, revised, reprinted automatically
or under user f. Can reports be edited or merged easily? g. Are the usual word processor features available, eg. cut and paste, copy, delete, bold face, italics, underline? h. Can the report generator access the data base by a query language? i. Can it in-bed data base entries in the text?
b.
Can porosity be calculated from c.
Can lithology be determined by d.
Can saturation be found from e. Are minimum, maximum and material balance constraints used effectively on porosity, shale content and water saturation? f. Is bad hole logic easy to use and set correctly? Can other discriminators be created and used to modify results or logic flow? g. Can all parameters in the formulae be modified by the user? h. Are reasonable defaults available for all parameters? i. Are method choices suggested by the program automatically (by the nature of the data available)? j. Can the methods and parameters selected be saved, modified, re-used? k. Can user supplied algorithms be incorporated and saved as part of the system? With or without programming assistance? What parameter naming convention is used to permit this? l. Can the models handle strange situations, such as radioactive minerals, bitumen, coal, or heavy minerals? Can the models utilize all the logs available (e.g. electromagnetic propagation, lithodensity and natural gamma ray)? m. Are all the routines logically connected for ease of use and understanding? n. Are all models corrected for shale, lithologic effects? o. Are quicklook methods easy and fast; are full blown methods reliable and achievable? p. Are productivity indicators included; eg. permeability, productivity index, deliverability, cash flow? q. Can core data be integrated into the analysis results, and used to calibrate parameters? r. Is the documentation of the models adequate? Are there worked examples or test data? Is the documentation current with the actual program?
b. What method is used to create the synthetic from the depth data? c. Is density data used? Is it corrected or edited for washed out hole? d. What output sample rates are available? e.
What wavelets are available f. Can you plot and print the Fourier Transform results of the raw data, the wavelet and the convolved trace? g. Can you further filter the data with band limiting filters? h. Can you input real seismic traces? Real seismic wavelets? i. Can you filter sonic and density data to correspond to frequency content inverted seismic data? j. Can you invert a seismic trace to obtain a sonic log? How do you input the trace? k. Can you edit logs to create hypothetical models? l. Can you describe the rock type, shale content, porosity and fluid content to calculate what the logs should read for various hypothetical models? m. Is the terminology on the menus suitable for use by geophysicists?
b.
Can data be entered on a c.
What method is used to interpolate contours d.
Does the system draw straight lines or smooth contours? What method
is used to e. Can geographic and township/range grids be generated? Will they work in all quadrants of the globe? f. Can well name, symbol and data value be posted on the maps (optionally)? g.
Can other line segments be digitized and plotted, such as roads,
geological or h. Are the contours properly annotated? Free of angularity? i. Can the title block be positioned to avoid interference? j. Can the maps be plotted on various projections (Lambert, Mercator, UTM)? k. Are there limits to the scale of the map or its size, of the plotter on which it can be drawn? l. Can areas and volumes be determined automatically? Will it run as a planimeter for any data? m. Can contours be edited and the areas and volumes re-calculated? n. Can maps be previewed on the CRT and dumped on the printer? o. Is colour used effectively?
b.
Does it communicate over c. What transmission rates are permitted? d.
Is the communication mechanism e.
What hardware is needed f.
Can the communication mechanism be configured for g.
Does the system keep an audit trail of events h. Does the system translate remote log or core data files into local files useable by the log analysis system? i.
Can you access other types of data such as j.
Can this data be put into the log analysis data files and be used
by the processing k. Is the system hard wired or dial-up? l. What data files in your area can you dial up or access directly? m. What software is needed on the host computer to create or pre-process files before data transmission occurs? n. What job control language knowledge is needed to log-on and utilize the host? o. Can the log-on and job request be coded as a standard part of the communications package? p. Can the log-on and job request be saved, modified, or re-used? q. Is there a better way to move the data (e.g. local tape drive)? r. What security features are available? Needed?
b.
Are help files c.
Is error recovery e.
Is the response time for each entry or request virtually instantaneous,
or is there a f.
Is data relatively secure g.
Are passwords h. Is the system self starting at power up, or do you need to invoke job control commands? i. Are the program functions (modules) interconnected or do you need to "run" each module separately? j.
Is the system driven by k.
Can you move about in the menu on the screen l.
Do menus (questions) m. Can regular or sophisticated users get abbreviated menus, or change menus for custom, repetitive jobs? n.
Is the system crash-proof - i.e. can you o.
Can the system handle both English and Metric data p. Can data be transmitted to a central data bank easily? What hardware or software is needed? q. Can data be transmitted or retrieved from another workstation or data base? r. Does the system have a good audit trail (can you tell what you did, what you did it to, when you did it, who did it, etc)? s. Is the audit trail saved? Is it part of the saved run stream to be used again? Can it be reviewed on paper or CRT? Scrolled on the CRT? t. Are questions, answers, and menus phrased in good English? Do they make sense the first time you see them? Can they be changed by the user? u. Does the system keep usage statistics for management review? v. Is the update procedure automatic? Does it retain all personalized defaults and customized algorithms? w. Is the system truly flexible and modifiable or are these just sales-words? x. Is the upgrade path known, achievable with limited training, affordable? y. Is maintenance path achievable with suppliers resources, affordable, reliable?
The analyst must be able to get information, repairs, training and support from the supplier. The analyst must communicate results quickly and cost effectively to the end user, staff and management. It is the end user who must understand and ultimately make use of the data from the system. The
following people oriented checklist will help reduce the chance
of failure of a computer aided system:
3.
The End Users 4.
Management |
||||||||||||||||||
|
Copyright ©
E. R. (Ross) Crain, P.Eng.
email |
||||||||||||||||||