This page describes induced gamma ray spectroscopy logs profiles, in the order of their appearance over the years. This presentation style provides insights into tool evolution, and a specific tool’s capabilities and limitations. You will find most these tool types in your well files – here’s your chance to learn more about them.
Activation, or induced gamma ray
spectroscopy,
logs record concentrations of individual chemical elements derived
from the characteristic energy levels of gamma rays emitted by a
nucleus that has been activated by neutron bombardment. Pulsed
neutron spectroscopy and elemental capture spectroscopy are other
common names for this kind of log. Chlorine, oxygen activation,
aluminum activation, and carbon oxygen logs also fall into this
category, as well as the reservoir saturation tool (RST), the
Litho-Scanner, and Pulsar logs.
The geochemical log (GST) and its successor the elemental capture
spectroscopy log (ECS) were widely used for hydrocarbon and mineral
identification. The GST and ECS could be run in either cased or open
hole. Slow logging speed reduced their early acceptance by industry
but the modern versions of spectroscopy logs are run at
normal speeds due to much improved detector design.
While chemical source tools emit
slow neutrons, meaning only elements from the capture spectrum
are counted, the PNG's elemental yields are derived from
two intermediate results: the inelastic and the capture
spectrum. The inelastic spectrum is the basis for the
carbon-oxygen log, and can also give information on other
elements. The capture spectrum depends on many elements, mainly
hydrogen, silicon, calcium, iron, sulfur and chlorine. The depth of investigation of the log is several inches into the formation. It can be run in open or cased hole. Pulsed neutron spectroscopy logs were introduced in the mid 1970s after a decade or more of investigation. Early tools were physically long, expensive and required complex interpretation models.
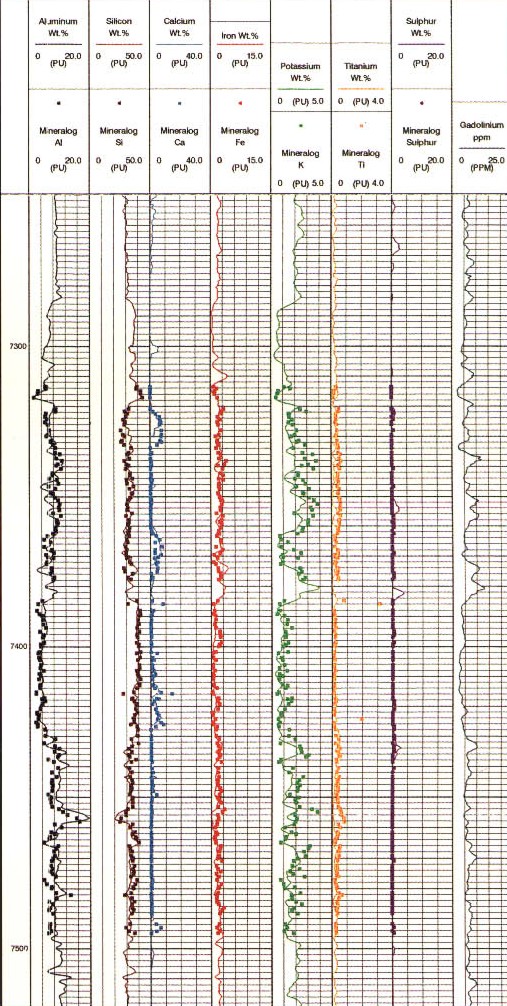
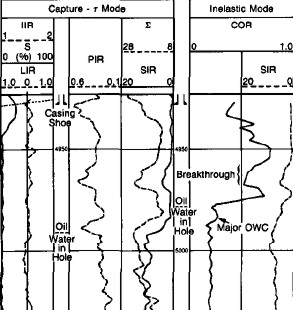
Raw log curves for a GST log
As for the pulsed neutron spectroscopy log, absolute concentrations can be derived by calibration to core or by using a model such as the oxide-closure model. The absolute elemental concentrations can then be converted into mineral concentrations using a model that defines what minerals are present. The first complete geochemical logs were run in the mid 1980s. The oxide-closure model for converting relative elemental yields from a pulsed neutron spectroscopy log to absolute weight concentrations uses the assumption that the sum of all oxides in the rock matrix is 1.00. The model is based on the observation that, with few exceptions, sedimentary minerals are oxides, so that the sum of the dry weight percent of all oxides must be 100%. The weight percent of an oxide can be calculated from the dry weight percent of the cation by knowing the chemical formula. The absolute dry
weight fraction, W, of element i is given by: The dry weight
fraction of the oxide is then:
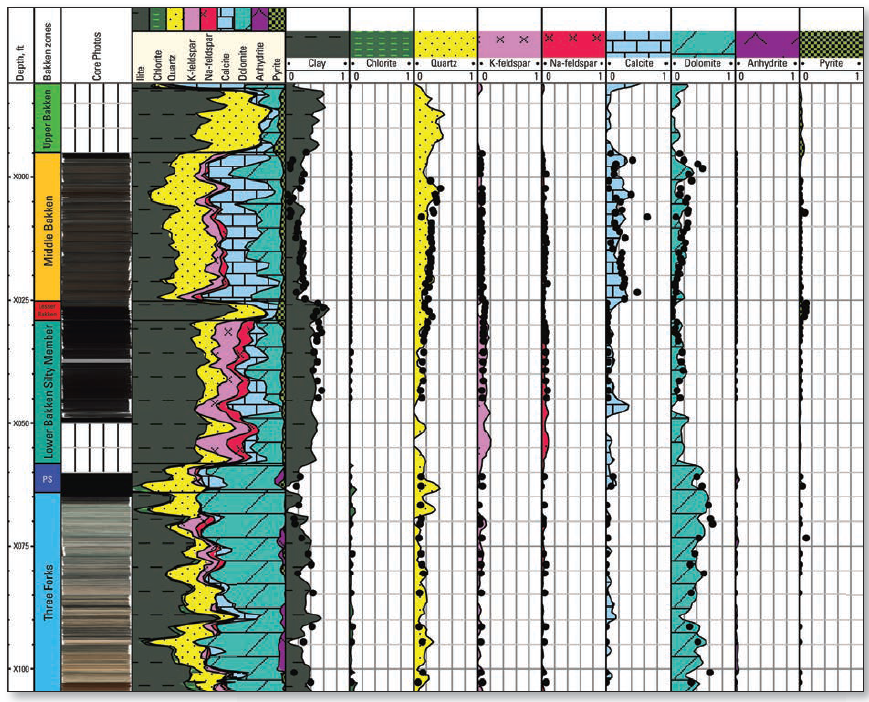
Wellsite
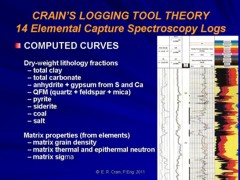
processing uses the 254-channel gamma ray energy spectrum to
produce dry-weight elements, lithology, and matrix properties.
The first step involves spectral deconvolution of the composite
gamma ray energy spectrum by using a set of elemental standards
to produce relative elemental yields. The relative yields are
then converted to dry-weight elemental
concentration logs for the elements Si, Fe, Ca, S, Ti, and Gd
using the oxides closure method. Matrix properties and
quantitative dry-weight lithologies are then calculated from the
dry-weight elemental fractions using empirical
relationships derived from an extensive core chemistry and
mineralogy database. The ECS tool was a mere 10.2 feet
long, beginning the trend to shorter, slimmer tools with an
increased logging speed, making them more attractive to
industry.
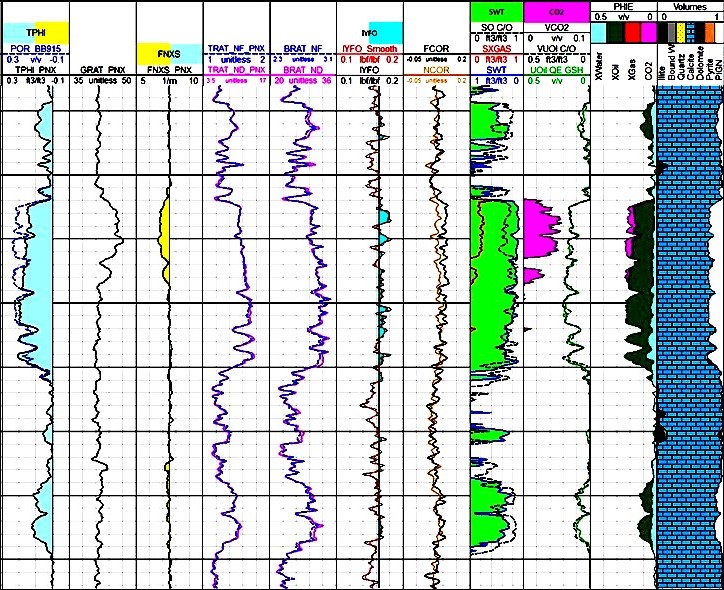
The
carbon/oxygen (C/O) ratio is used to determine the formation oil
saturation independent of the formation water salinity. This
calculation is particularly helpful if the water salinity is low
or unknown. If the salinity of the formation water is high, the
dual burst thermal decay time measurement is used. A combination
of both measurements can be used to detect and quantify the
presence of injection water of a different salinity from that of
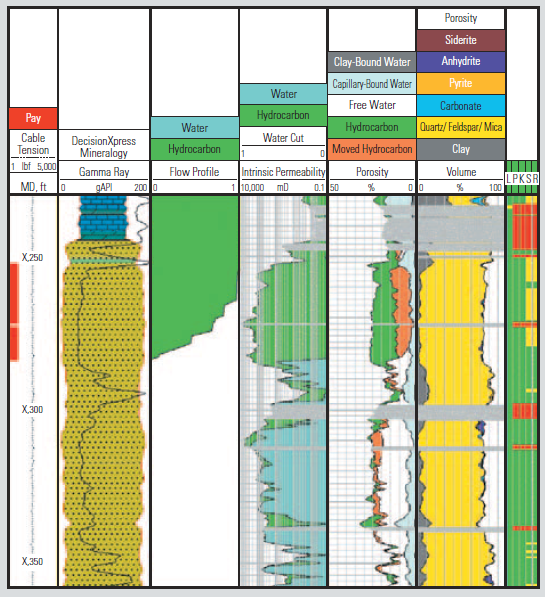
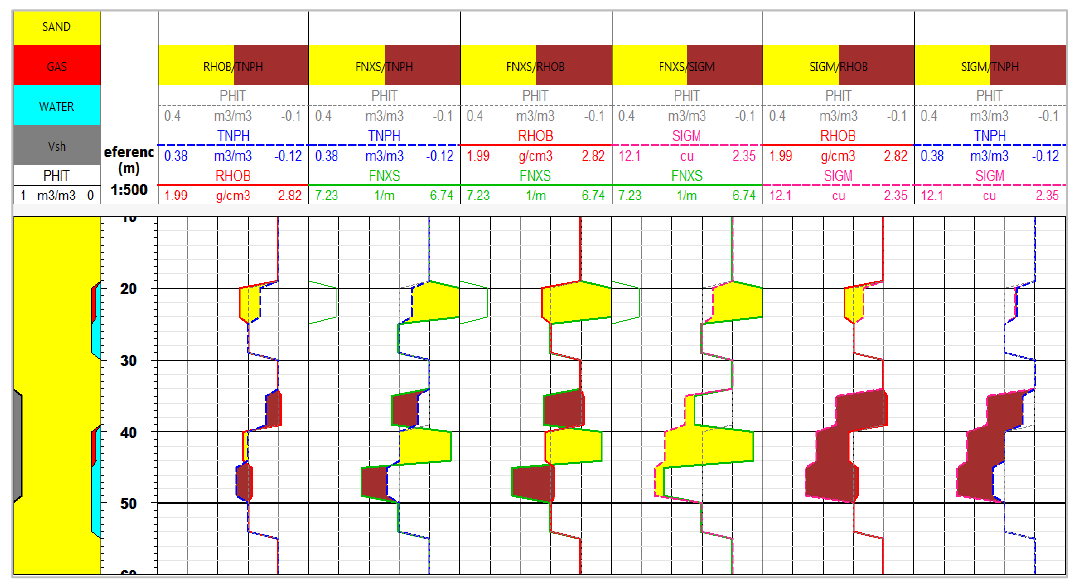
the connate water. The current generation lithology tool is called LithoScanner (Schlumberger terminology). ECS’s chemical AmBe source was replaced with a high-output pulsed neutron generator (PNG) and the BGO detector superseded by a LaBr3:Ce scintillator having 3 times better resolution. These design changes increase the neutron output by a factor of ~7 over a chemical source. Inelastic interactions are separated from capture data due to source timing; a pulse-height histogram, or spectra, is generated during and after each neutron burst. Some elements, such as carbon and oxygen, have a signature in just one spectra; others are present in both, meaning some elements are measured with greater precision while other elements are newly quantified. Twenty-one elements making up eight mineral groups are output, including magnesium, which allows the differentiation of dolomite from calcite, and aluminum for computing clay volume. Inorganic carbon is measured and subtracted from total inelastic carbon, giving a stand-alone TOC. This is key to computing kerogen volume in shale gas plays. Additionally, elements such as copper can be used for metal ore assays. Importantly, unlike a chemical source tool, the Pulsed Neutron Generator does not emit radiation unless activated, making it safer to use and more environmentally friendly. The slim 4.5” OD tool has a depth of investigation of 7 to 9” with a vertical resolution of 18” and a logging speed up to 3600 ft/hour. Outputs: ■ Elemental Yields ■ Elemental Weight Fractions: Al, Ba, Br, C, Ca, Cl, Cu, Fe, Gd, H, K, Mg, Mn, Na, Ni, O, P, S, Si, Sr, Ti ■ Total Organic Carbon (TOC) ■ Dry Weight Mineral Concentrations – Anhydrite, Clay, Calcite, Coal, Dolomite, Evaporite, Pyrite, QFM, Siderite ■ Matrix Properties (Density, Neutron and Sigma) Applications: ■ Shale Gas Reservoirs (Kerogen Volume and Hydrocarbon Saturation from TOC) ■ Mechanical Properties ■ Facies Identification ■ Sequence Stratigraphy and Clay Typing 2015 saw the introduction of a new measurement: FNXS, or Fast Neutron Cross-Section, which detects neutrons induced from fast neutron inelastic scattering. The Schlumberger tool, Pulsar, combines high neutron outputs with multiple detectors in a 1.73” OD slim-hole tool, designed to be run in cased holes through tubing. The tool can be operated rig-less and is a good choice for horizontals, or wells with instability issues. The major application is the detection of gas zones: the fast neutron cross section values are similar for both matrix and water but read much lower in gas. This is presented in an FNXS TPHI curve overlay which shows better resolution than the open hole density neutron gas crossover method. Unique to cased-hole interpretation, it is no longer necessary to have open hole density logs. The tool logging speed varies according to the acquisition mode, from 200 ft/hour in inelastic capture mode, up to 3600 ft/hour in inelastic gas, sigma and HI mode. Outputs: ■ Sigma ■ HI Hydrogen Index ■ TPHI Thermal Neutron Porosity ■ FNXS Fast Neutron Cross-Section ■ Inelastic and Capture Elemental Yields ■ Elemental Weight Fractions: Al, Ba, Br, C, Ca, Cl, Cu, Fe, Gd, H, K, Mg, Mn, Na, Ni, O, P, S, Si, Sr, Ti ■ Carbon/Oxygen Ratio ■ Total Organic Carbon (TOC)
Applications: ■ Standalone Formation Evaluation (bypassed zones, depleted reservoirs, wells with no OH or ancient logs and Carbon Storage reservoirs) ■ Differentiate and quantify gas zones from liquid-filled porosity or tight zones ■ Water saturation regardless of salinity ■ Low-resistivity pay evaluation ■ Well-to-well correlation and sequence stratigraphy ■ Detection of water entry and flow behind casing
showing better gas and clay response.
|
|
||
|
Page Views ---- Since 01 Jan 2015
Copyright 2023 by Accessible Petrophysics Ltd. CPH Logo, "CPH", "CPH Gold Member", "CPH Platinum Member", "Crain's Rules", "Meta/Log", "Computer-Ready-Math", "Petro/Fusion Scripts" are Trademarks of the Author |
|||

|
||
| Site Navigation | TOOL PROFILES INDUCED GAMMA RAY SPECTROSCOPY LOGS | Quick Links |
 The
induced gamma ray spectroscopy log, also called the geochemical log, is a more recent
spectroscopy incarnation and was run in
cased hole as the GST tool and in open hole as the GLT tool
(Schlumberger terminology). It is a log of elemental
concentrations from which the geochemistry of the formation may
be derived.
The
induced gamma ray spectroscopy log, also called the geochemical log, is a more recent
spectroscopy incarnation and was run in
cased hole as the GST tool and in open hole as the GLT tool
(Schlumberger terminology). It is a log of elemental
concentrations from which the geochemistry of the formation may
be derived.