|
 Electromagnetic PROPAGATION
LOG BASICS
Electromagnetic PROPAGATION
LOG BASICS
Three
tool types measure formation dielectric permittivity. Two
are legacy tools, the oldest being the DLT, a low frequency
tool consisting of coils on a mandrel, operating in the 50
to 200 megahertz range. The second legacy tool, the high
frequency EPT or Electromagnetic Propagation Tool,
transmitted 1.1 GHz from a pad contact device with two
transmitter receiver pairs. The newest dielectric tool is
the Array Dielectric Tool (ADT Schlumberger mnemonics).
The ADT scans 4 frequencies between 20 MHz and 1 GHz.
The
Baker DLT tool restricts the frequency range to 47 to 200
MHz.
All these tools can be used to estimate invaded zone water
saturation Sxo = PHIept / PHIt. Under the right conditions
(shallow invasion, reasonably deep investigation) the Sxo
may approach the undisturbed zone water saturation SWept.
The measurement is relatively independent of water salinity
at salinities above 10,000 ppm NaCl so it is a helpful guide
to spotting hydrocarbons in fresh water environments.
Its major use is in heavy oil wells, such as those in
California and western Canada, and in EOR projects where
water, CO2, and chemical floods have confused the original
water resistivity regime.
The newer array (scanner) tools can be useful
in carbonate reservoirs, where electrical properties are
unknown.
The electromagnetic principles involved
in dielectric logging tools are described by
Maxwell's Laws.
Reference:
1. Electromagnetic Propagation - A New Dimension In Logging
T.J. Calvert, R.N. Rau, L.E. Wells,
AIME, 1977
LOW FREQUENCY DIELECTRIC
LOGS (DLT)
On low frequency DLT tools, curves presented varied
considerably but might include attenuation, phase shift, relative dielectric
permittivity, or resistivity. The advantage of
the DLT propagation log is that the lower frequency permits
a larger depth of investigation and therefore an analysis of
the undisturbed zone may be more likely.
HIGH FREQUENCY Electromagnetic PROPAGATION
LOGS
EPT logs measure propagation time (TPLP and signal
attenuation (ATTEN). Both are strongly affected by water so
water filled porosity can be calculated from these values.
As a 1 GHz tool, depth of investigation was very shallow. In heavy oil, where invasion is shallow, this water volume
is close to the irreducible water. PHIept = PHIe only in
water zones.
Logging tools today use a skid-mounted transmitter-receiver
array. Older tools were mandrel style and
measurements were more seriously affected by rough or large
borehole conditions. Bed resolution is a function of the antenna
spacing and the firing mode. End-fire gives resolution of an
inch or two and broadside a foot or a little more. The
attenuation curve on the EPT was an excellent shale indicator in
laminated shaly sands, compared to the 3 foot resolution of a
gamma ray log.
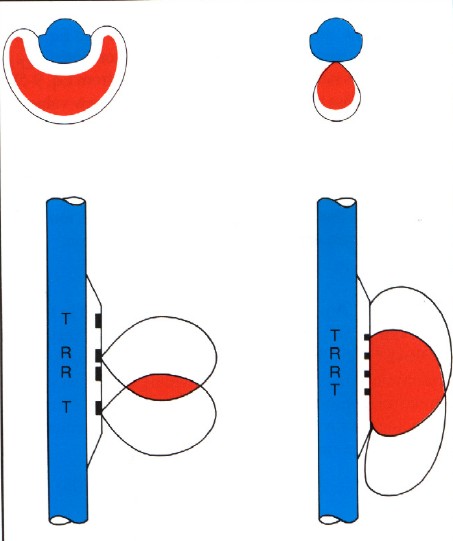
EPT tool concept, with two transmitters and two receivers, in
end-fire (left) and broadside
(right) measuring modes. Region investigated (red) varies with
resistivity contrast between Rxo
and Rt, tool frequency, and firing mode.
MULTI FREQUENCY array DIELECTRIC
LOGS (ADT)
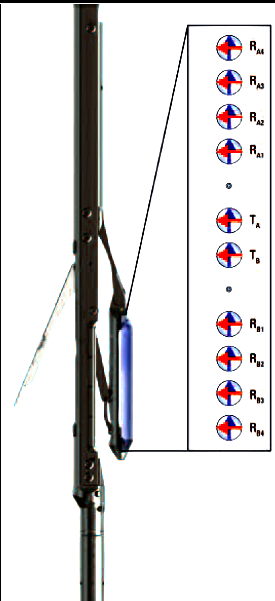
The ADT measures formation
dielectric at four frequencies, 20, 100, 500 MHz and 1 GHz. The ADT
consists of four receiver antennas symmetrically arranged around two
transmitter antennas, plus 2 shallow mud-cake probes on an
articulated pad. A total of 9 measurements are made per depth
level, outputting permittivity
e and
conductivity s
for each frequency. Processing using a
geometrical model gives a radial resistivity profile of the
reservoir. The magnitude of epsilon quantifies the fluids and rock
types near the wellbore. The signal phase shift and attenuation is
transformed to water-filled porosity and compared on the log to
total porosity. The textural arrangement of fluids and matrix is
calculated and displayed as the Archie m=n curve. The depth of
investigation is 1-4”, with a vertical resolution of 1”.
Multi frequency dielectric
tool skid and transmitter - receiver layout ==>
DIELECTRIC
LOG CURVE NAMES
|
DLT Log |
|
|
|
Curves |
Units |
Abbreviations |
| permittivity |
unitless |
EPSILON |
|
resistivity |
ohm-m |
Rept |
|
attenuation |
db/m |
ATTEN |
| *
gamma ray |
api |
GR |
| caliper |
in
or mm |
CAL |
| porosity
from DLT |
%
of frac |
PHIEPT |
|
|
|
|
|
|
|
|
|
EPT Log |
|
|
|
Curves |
Units |
Abbreviations |
| EPT travel
time |
nsec/m |
TPL |
| signal
level (near) |
db |
LNEAR |
| signal
level (far) |
db |
LFAR |
|
attenuation |
db/m |
ATTEN |
| * gamma
ray |
api |
GR |
| caliper |
in or mm |
CAL |
| porosity
from EPT |
% of frac |
PHIEPT |
| |
|
|
| |
|
|
|
ADT LOG |
|
|
| Curves |
Units |
Abbreviations |
| permittivity |
unitless |
EPSILON |
| invaded zone resistivity |
ohm-m |
RXOadt |
| * gamma ray |
api |
GR |
| caliper |
in or mm |
CAL |
| water filled porosity |
% of frac |
PHIadt |
| dielectric water saturation |
% of frac |
SWadt |
| archie m=n |
unitless |
m=n |
EXAMPLES OF
Electromagnetic PROPAGATION
LOGS
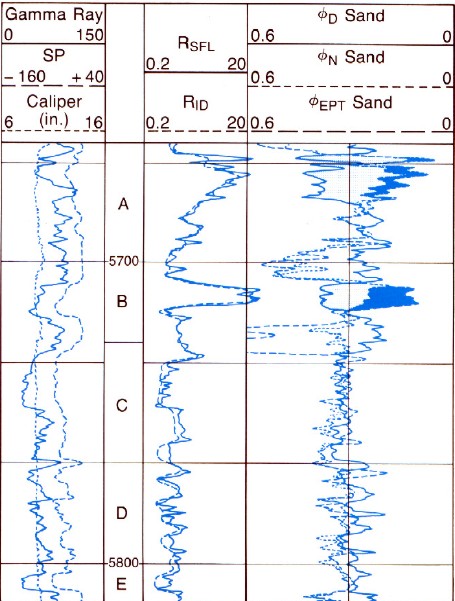
EPT log with deep induction, gamma ray, neutron and density.
Zone A is gas (density neutron crossover, PHIept is low), Zone B
is oil (no crossover, PHIept is low), Zones C, D, and E are wet
(PHIept = PHIxdn).
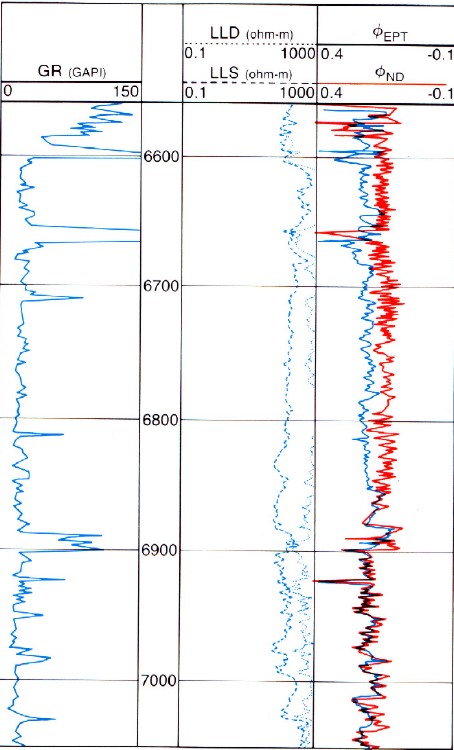
EPT porosity overlay on density neutron porosity shows residual
hydrocarbon.
PHIept (red) and PHIxdn (blue) in an oil zone. Oil water contact
is located where red and blue curves meet near bottom of log at
about 6860 feet. Resistivity contrast (Track 2) does not define
contact clearly. Porosity curve separation is only a hydrocarbon
locator, as this is light oil, with invasion.
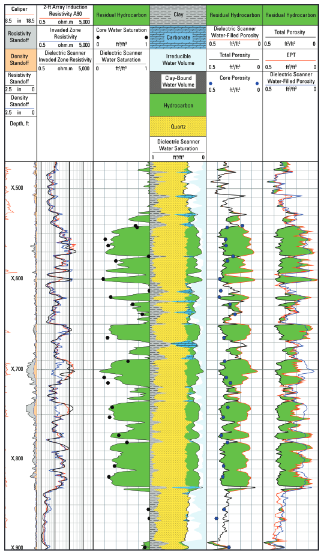
Comparison of porosity from dielectric scanner (ADT)
and EPT with total porosity (track 5) shows bypassed pay in
rough boreholes (x690-x710 and x740-x755), (track 4). The skid mounted multiple detectors on the
ADT reduces
borehole effects.
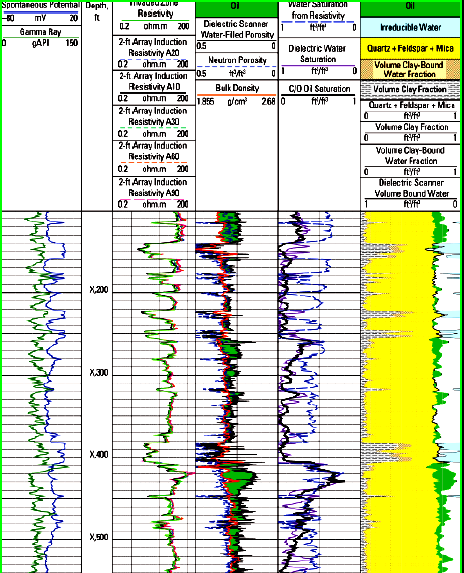
Comparison of array induction, carbon oxygen, and dielectric
phase logs.
The multi-frequency dielectric dispersion measurement clearly
enables interpretation of the hydrocarbon zones from X260-X280
feet and X410-X440 feet in (Track 5). The standard triple combo
log was overly optimistic, showing freshwater zones as potential
oil zones.
|