|
 CORE Fluid saturation BASICs
Most
oil and gas reservoirs are water wet; water coats the surface
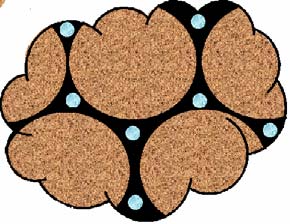
of each rock grain. A few reservoirs are oil wet, with oil on
the rock surface and water contained in the pores, surrounded by
oil. Some reservoirs are partially oil wet. Oil wet reservoirs
are very poor producers as it is difficult to get the oil to
detach itself from the rock surface. It is fairly easy to take a
core sample, clean it and dry it, then make the rock oil wet.
However, reservoir rocks are seldom clean and dry, so that same
rock in-situ will often be water wet.
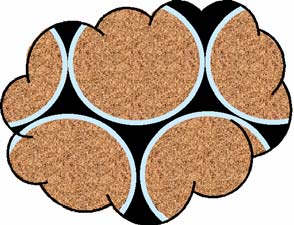 
A water wet reservoir (left)
An oil wet reservoir (right)
Conventional cores are
usually invaded with drilling fluid so the saturations do
not represent the state of the reservoir, except in very
heavy oil and tar sands. In conventional oil reservoirs, the
oil saruration in the recovered core is often close to the
residual oil saturation.
Cores can be preserved while coring using plastic sleeves;
saturations more closely represent reservoir conditions. The
native state of a core can be simulated by first cleaning
the core, then reinjecting water and oil with properties
similar to the original fluids.
CORE Fluid saturation definitions
Saturation of a particular fluid is the
proportion of that fluid compared to the porosity:
* Vwtr = volume of water extracted from the core
* Voil = volume of oil extracted from the core
* Vgas = volume of gas extracted from the core
* Swtr = water saturation = Vwtr / PHIcore
* Soil = oil saturation = Voil / PHIcore
* Sgas = Vgas / PHIcore
4: Swtr + Soil + Sgas = 1.00
In the laboratory, it is easier to measure weight (mass)
than volume, although both are often recorded.
* Fluid weight = Weight water + Weight oil
+ Weight gas
*
OR Fluid weight = DENSwtr * Vwtr + DENSoil * Voil + DENSgas * Vgas
*
OR Fluid weight = PHIcore * (DENSwtr * Swtr + DENSoil * Soil + DENSgas *
Sgas)
During coring, moveable hydrocarbons are
flushed from the core and replaced by mud filtrate, leaving residual
oil and irreducible water. Some of the irreducible water may be
replaced by mud filtrate as well. During recovery and transport of
the core, the majority of the water will drain out, leaving residual
oil and irreducible water. The sum of residual oil saturation plus
irreducible water saturation is usually less than 1.0, the balance
being the moveable oil saturation. In older reservoirs with many
years of production, there may also be some moveable water. This
will also be flushed by the mud filtrate. To appreciate the meaning
of the core saturations, it is important to know the history
of a reservoir relative to the when the core was cut.
In petrophysical analysis, we utilize the core water saturation as a
guide to the irreducible water saturation in a reservoir above the
transition zone. In a core, the difference between residual oil and
water saturation is usually assumed to be the moveable oil fraction
of the reservoir fluids, when the reservoir is at initial
conditions. The core water saturation is usully assumed to be close
to the irreducible water saturation.
In older reservoirs, no longer at initial conditions,, there may be
some moveable water as well as the moveable oil. This can often be
seen on the log analysis results depth plots where log analysis
saturation is higher than core water saturation. The excess water
saturaton is a measure of potential water production.
If corroboration of water
saturation is required, air-brine capillary pressures should be
taken, along with electrical properties, from at least a dozen core
plugs with some variations in porosity or pore geometry. This will
resolve the initial irreducible water saturation question. A
reservoir simulation history match would be
needed to resolve the question of moveable water saturation.
Cores
taken in oil based mud give a better view of irreducible water, as
these muds do not displace the water.
The main use for core analysis oil saturation in
conventional reservoirs is to estimate
minimum possible residual oil saturation, and to assist in locating
gas-oil and oil-water contacts. Gas and water zones have low
residual oil, unless they were once oil zones (recently or in
earlier geologic time). Oil saturation from core analysis is quite
useful in tar sand and sometimes in heavy oil evaluations, where
flushing is minimal.
In oil sands (tar sands), the oil mass is the primary measurement
used to evaluate reservoir quality and oil in place calculations.
Since there is no drilling fluid invasion in a tar sand core (unless
free gas is also present in the pore space) the sum of Soil + Swtr =
1.0.
CORE saturation measurements
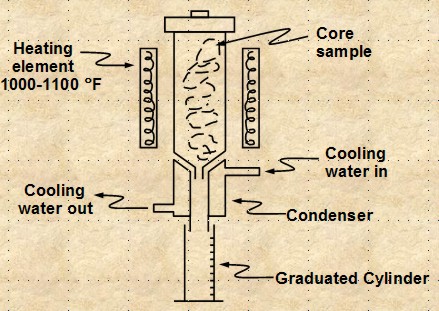 A
common method for direct measurement of saturation in a core sample
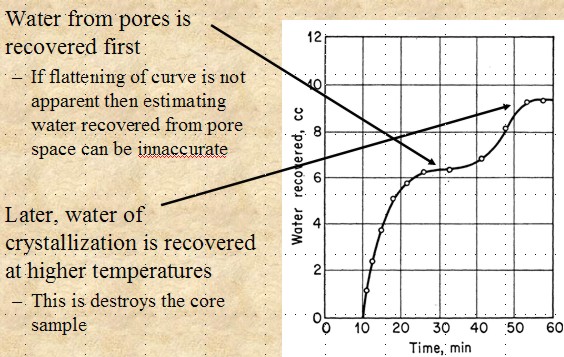
is the distillation retort method. Core samples are heated, fluids
are vaporized and condensed into a graduated glass receptacle. This
is a rapid method to determine oil and water volumes. Unfortunately,
high temperature (1100 F) may destroy the sample and drives off clay
bound water (CBW). Clay bound water may be estimated by observation
of water volume versus time - pore water is recovered first and clay
bound water later, as the temperature increases.. A
common method for direct measurement of saturation in a core sample
is the distillation retort method. Core samples are heated, fluids
are vaporized and condensed into a graduated glass receptacle. This
is a rapid method to determine oil and water volumes. Unfortunately,
high temperature (1100 F) may destroy the sample and drives off clay
bound water (CBW). Clay bound water may be estimated by observation
of water volume versus time - pore water is recovered first and clay
bound water later, as the temperature increases..
In a core drilled with water base mud, the oil volume is
divided by the porosity to obtain a residual oil saturation.
Similarly, a water saturation is determined, but the sum of Soil + Swtr will not equal 1.00 due to evaporation of water prior to the
measurement. In an oil based core, the sum of fluid volumes gives
total porosity (PHIt).
In both cases, coking and cracking of the oil reduces oil
volume, resulting in low estimated oil saturation. Core lab
companies scale the recovered oil by a factor to account for this.
The scale factor (KSF) varies from about 1.08 for light oil to 1.28
for heavy oil. Final results are calculated from:
8: Swtr = (Vwtr - CBW) / PHIe
9: Soil = (Voil * KSF) / PHIe
PHIe is usually determined by an independent lab method from
a very nearby core sample.
 The
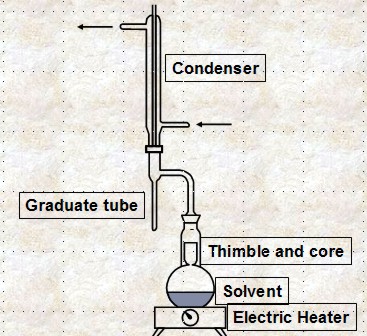
solvent extraction method is somewhat similar. The core sample is
held in a thimble above a source of solvent, which is heated. The
solvent vapour mobilizes the water, dissolves the oil, and all are
condensed, recovered, and measured. The
solvent extraction method is somewhat similar. The core sample is
held in a thimble above a source of solvent, which is heated. The
solvent vapour mobilizes the water, dissolves the oil, and all are
condensed, recovered, and measured.
The method gives an accurate water saturation, can be done
as part of the core cleaning process, and is non-destructive. The
method is slow and can take several days. Oil saturation is
determined by an indirect method, as follows:
10: Swtr = Vwtr / PHIe
11: Voil = ((WTinit - WTdry) - Vwtr *
DENSwtr)
/ DENSoil
12: Soil = Voil / PHIe
Only in rare cases will Soil + Swtr = 1.00 - the balance is
Sgas, usually air that entered the core during transport and
storage.
SAMPLE CORE ANALYSIS REPORT
|
02181815W4R |
#27771 |
780118 |
|
Revised Analysis - Soil and Swtr from
Original Analysis |
|
S# |
Top |
Base |
Len |
Kmax |
K90 |
Kvert |
Poros |
GrDen |
BkDen |
Soil |
Swtr |
Lithology |
|
|
feet |
feet |
feet |
mD |
mD |
mD |
frac |
kg/m3 |
kg/m3 |
frac |
frac |
|
|
1 |
3499.19 |
3500.17 |
0.98 |
370.0 |
316.0 |
264.0 |
0.255 |
2850 |
2378 |
0.129 |
0.448 |
SS VF |
|
2 |
3500.17 |
3501.16 |
0.98 |
445.0 |
425.0 |
326.0 |
0.248 |
2680 |
2263 |
0.123 |
0.450 |
SS VF |
|
3 |
3501.16 |
3502.17 |
1.02 |
764.0 |
751.0 |
231.0 |
0.248 |
2670 |
2256 |
0.111 |
0.520 |
SS VF |
|
4 |
3502.17 |
3503.16 |
0.98 |
445.0 |
417.0 |
127.0 |
0.234 |
2670 |
2279 |
0.129 |
0.479 |
SS VF |
|
5 |
3503.16 |
3503.88 |
0.72 |
479.0 |
411.0 |
84.0 |
0.241 |
2700 |
2290 |
0.110 |
0.504 |
SS VF PRY |
|
6 |
3503.88 |
3504.57 |
0.69 |
860.0 |
790.0 |
172.0 |
0.242 |
2680 |
2273 |
0.118 |
0.466 |
SS VF |
|
7 |
3504.57 |
3504.67 |
0.10 |
|
0.1 |
0.1 |
|
|
|
|
|
SHALE |
|
8 |
3504.67 |
3505.26 |
0.59 |
|
0.1 |
0.1 |
|
|
|
0.151 |
0.398 |
RUBBLE |
|
9 |
3505.26 |
3505.49 |
0.23 |
486.0 |
402.0 |
261.0 |
0.246 |
2670 |
2259 |
0.134 |
0.358 |
SS VF SH INC |
|
10 |
3505.49 |
3505.98 |
0.49 |
355.0 |
326.0 |
8.3 |
0.207 |
2640 |
2301 |
0.143 |
0.268 |
SS VF SHBKS |
|
11 |
3505.98 |
3506.96 |
0.98 |
376.0 |
192.0 |
32.2 |
0.240 |
2650 |
2254 |
0.131 |
0.471 |
SS VF |
|
12 |
3506.96 |
3507.88 |
0.92 |
250.0 |
245.0 |
17.6 |
0.218 |
2640 |
2282 |
0.156 |
0.399 |
SS VF CARB INC |
|
13 |
3507.88 |
3508.47 |
0.59 |
491.0 |
0.1 |
0.1 |
0.237 |
|
|
0.119 |
0.389 |
SS VF |
|
14 |
3508.47 |
3508.87 |
0.39 |
304.0 |
0.1 |
0.1 |
0.219 |
|
|
0.136 |
0.422 |
SS VF CARB BK |
|
15 |
3508.87 |
3509.88 |
1.02 |
309.0 |
288.0 |
127.0 |
0.230 |
2850 |
2425 |
0.132 |
0.440 |
SS VF |
|
16 |
3509.88 |
3510.87 |
0.98 |
845.0 |
340.0 |
135.0 |
0.237 |
2660 |
2267 |
0.131 |
0.323 |
SS VF SH INC |
|
17 |
3510.87 |
3511.88 |
1.02 |
298.0 |
287.0 |
75.3 |
0.218 |
2650 |
2290 |
0.146 |
0.422 |
SS VF SH INC |
|
18 |
3511.88 |
3512.87 |
0.98 |
139.0 |
0.1 |
0.1 |
0.208 |
2650 |
2307 |
0.103 |
0.354 |
SS VF |
|
19 |
3512.87 |
3513.79 |
0.92 |
139.0 |
0.1 |
0.1 |
0.174 |
|
|
0.073 |
0.418 |
SS VF |
|
20 |
3513.79 |
3514.38 |
0.59 |
|
0.1 |
0.1 |
|
|
|
0.096 |
0.441 |
RUBBLE |
|
21 |
3514.38 |
3515.07 |
0.69 |
65.1 |
0.1 |
0.1 |
0.257 |
|
|
0.119 |
0.387 |
SS VF |
|
22 |
3515.07 |
3515.16 |
0.10 |
|
0.1 |
0.1 |
|
|
|
|
|
SHALE |
|
23 |
3515.16 |
3516.18 |
1.02 |
1050.0 |
385.0 |
385.0 |
0.254 |
2670 |
2246 |
0.044 |
0.492 |
SS VF |
|
24 |
3516.18 |
3516.77 |
0.59 |
385.0 |
471.0 |
471.0 |
0.220 |
2660 |
2295 |
0.042 |
0.501 |
SS VF |
|
25 |
3516.77 |
3517.46 |
0.69 |
835.0 |
183.0 |
183.0 |
0.237 |
2670 |
2274 |
0.050 |
0.531 |
SS VF CARB INC |
|
26 |
3517.46 |
3518.28 |
0.82 |
901.0 |
644.0 |
644.0 |
0.238 |
2650 |
2257 |
0.046 |
0.487 |
SS VF |
|
27 |
3518.28 |
3519.07 |
0.79 |
438.0 |
103.0 |
103.0 |
0.240 |
2690 |
2284 |
0.079 |
0.494 |
SS VF CARB INC |
|
28 |
3519.07 |
3519.99 |
0.92 |
1430.0 |
278.0 |
278.0 |
0.251 |
2660 |
2243 |
0.063 |
0.501 |
SS VF |
|
29 |
3519.99 |
3520.58 |
0.59 |
|
0.1 |
0.1 |
|
|
|
0.052 |
0.563 |
RUBBLE |
|
30 |
3520.58 |
3521.46 |
0.89 |
1050.0 |
951.0 |
951.0 |
0.258 |
2570 |
2165 |
0.055 |
0.516 |
SS VF |
|
31 |
3521.46 |
3522.48 |
1.02 |
382.0 |
61.5 |
61.5 |
0.210 |
2690 |
2335 |
0.064 |
0.450 |
SS M P/SCARB INC |
|
32 |
3522.48 |
3523.47 |
0.98 |
570.0 |
48.9 |
48.9 |
0.186 |
2680 |
2368 |
0.058 |
0.408 |
SS M P/SCARB INC |
|
33 |
3523.47 |
3524.48 |
1.02 |
|
0.1 |
0.1 |
|
|
|
0.082 |
0.411 |
RUBBLE |
|
34 |
3524.48 |
3525.47 |
0.98 |
3149.0 |
321.0 |
321.0 |
0.209 |
2590 |
2258 |
0.051 |
0.391 |
SS VF |
|
35 |
3525.47 |
3526.48 |
1.02 |
|
0.1 |
0.1 |
|
|
|
0.073 |
0.360 |
RUBBLE |
|
36 |
3526.48 |
3527.47 |
0.98 |
285.0 |
48.8 |
18.8 |
0.170 |
2690 |
2403 |
0.046 |
0.481 |
SS M P/S |
|
37 |
3527.47 |
3528.16 |
0.69 |
193.0 |
0.1 |
0.1 |
0.169 |
2770 |
2471 |
0.042 |
0.548 |
SS M P/S CARB |
|
38 |
3528.16 |
3528.88 |
0.72 |
|
0.1 |
0.1 |
|
|
|
0.066 |
0.462 |
RUBBLE |
|
|
|
|
|
|
|
|
|
|
|
|
|
|
|
Arithmetic Averages |
0.78 |
602.9 |
228.6 |
140.2 |
0.227 |
2679 |
2297 |
0.095 |
0.443 |
|
|
|
|
|
|
|
|
|
|
|
|
|
|
|
Use the
oil saturation (Soil) data in this core analysis example to find
the oil - water contact.
CALIBRATING LOG ANALYSIS TO CORE SATURATION EXAMPLES
These examples demonstrate the close match between log analysis
water saturation and core analysis water saturation. It works most
of the time, especially with cores cut after the mid 1980's,
provided they have been handled according to best practices. If it
doesn't work, or doesn't seem to make sense, forget it and move on.
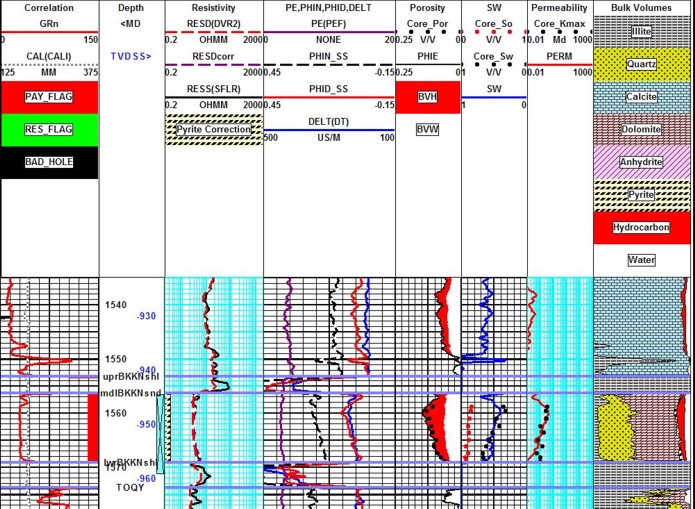
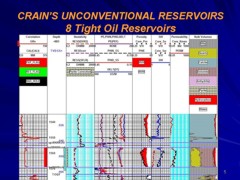
Bakken “Tight Oil” example showing core porosity (black dots), core
oil saturation (red dots). core water saturation (blue dots), and
permeability (red dots). Note excellent agreement between log
analysis and core data. Separation between red dots and blue water
saturation curve indicates significant moveable oil, even though
water saturation is relatively high. Log analysis porosity is from
the complex lithology model and lithology is from a 3-mineral PE-D-N
model using quartz, dolomite and pyrite.
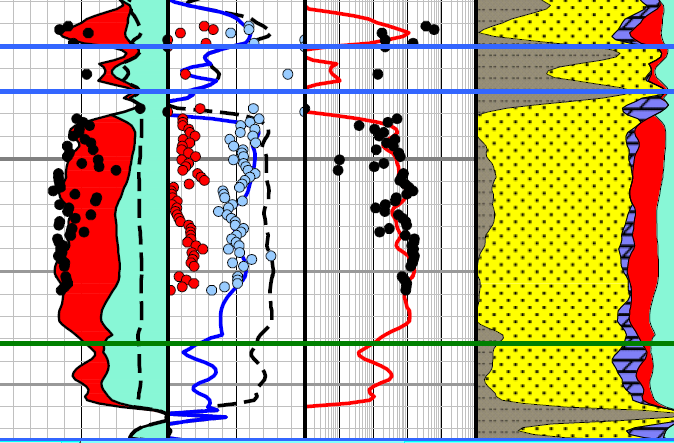
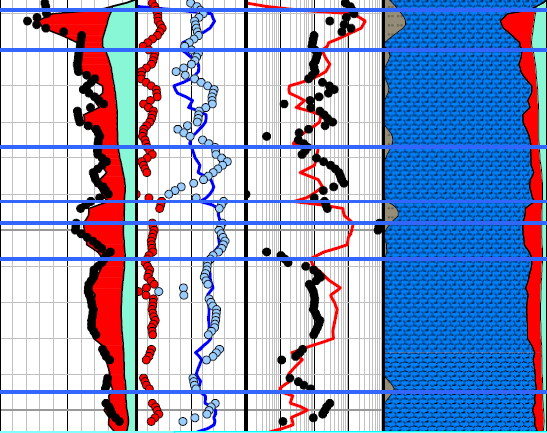
Sandstone example (left) and carbonate example (right) showing close
match of log analysis and core analysis water saturation. Black dots
are core porosity and permeability. Light blue dots are core
analysis water saturation, which fall close to log analysis
saturation curve (blue). Red dots on sandstone example are residual
oil saturation, showing lots of moveable oil between the water
curve, even though the water saturations are quite high (due to poor
pore geometry).

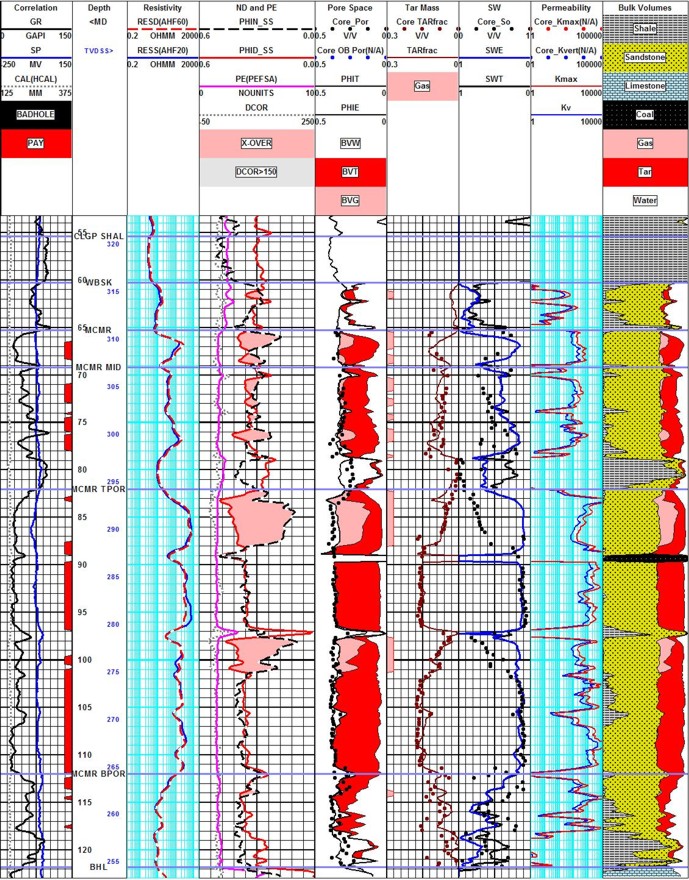
Oil sand analysis with top water, bottom
water, top gas, and mid zone gas. Core and log data match - but oil
mass is the critical measure of success. Core porosity matches total
porosity from logs, due to the nature of the summation of fluids
method used in these unconsolidated sands. Minor coal streaks occur
in this particular area.
|