1: PHIdc = PHID – (Vsh * PHIDSH) 2: PHInc = PHIN – (Vsh * PHINSH)
PHIDSH and PHINSH are constants for each zone, and are picked only once.
STEP 2: Check for gas crossover after shale corrections and calculate porosity for each layer from the correct equation: 3: IF PHInc >= PHIdc, there is no gas crossover 4: THEN PHIxdn = (PHInc + PHIdc) / 2
The density neutron crossplot porosity, PHIxdn, after all corrections are applied, is called the effective porosity, PHIe.
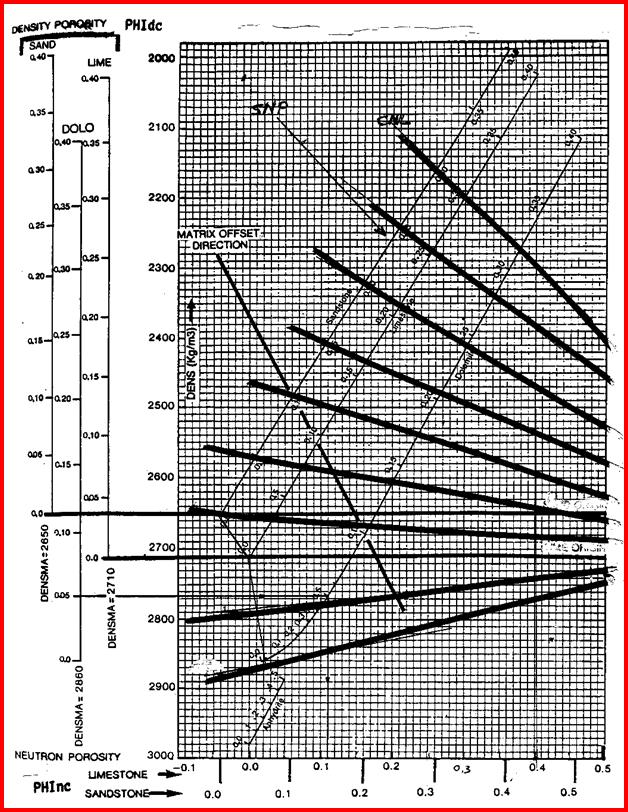
Density Neutron Complex Lithology Crossplot
- Oil and Water cases,
Chartbook solutions are provided above. Shale corrected data must be entered.
· Do not use when density is affected by bad hole conditions.
· No correction for log units (eg Sandstone or Limestone units) is needed for most cases, except gas in dolomite and low porosity dolomite. Use Limestone units log ONLY for these two special cases (See below).
· Shale corrections could create apparent gas crossover and this may be real or an artifact of excessive correction. Check against known data from the well if shale correction creates crossover.
· To calibrate to core porosity, adjust PHIDSH, PHINSH, or Vsh to obtain a better match by trial and error. Appropriate crossplots may assist, or regression of PHIxdn vs core porosity may be used.
CASE 1: IF gas is known to be present AND gas crossover occurs after shale corrections, apply the following gas correction: 6: IF PHInc < PHIdc, there is gas crossover 7: THEN PHIxdn = ((PHInc ^ 2 + PHIdc ^ 2) / 2) ^ 0.5
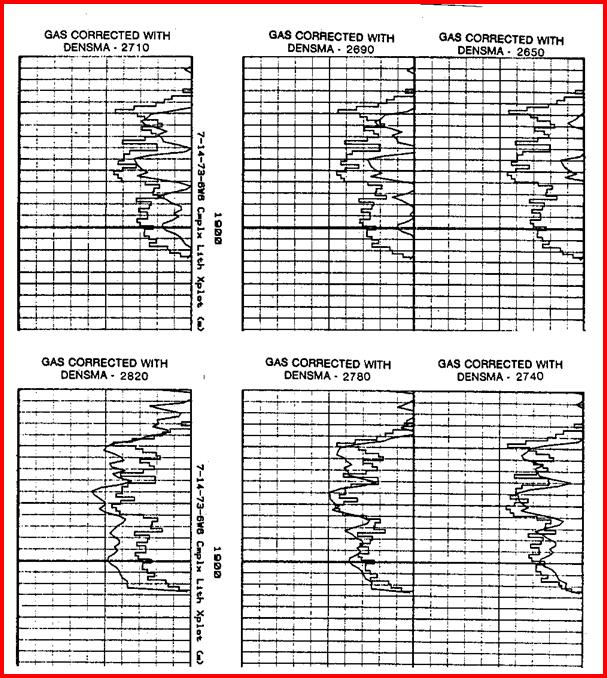
CASE 2: IF gas is known to be present but NO crossover occurs after shale corrections, this usually means gas in dolomite or in a sandstone with lots of heavy minerals. First, assume or calculate the matrix density
(DENSMAgc) based
on the PE curve (PE is the only curve unaffected by gas): Where:
DENSMAgc can be computed as a continuous curve or used as a zone
parameter to replace DENSMA in equation 8. 11: PHIx = – PHIdc / (PHInc / 0.8 – 1) / (1 + PHIdc / (0.8 – PHInc)) 12: PHIxdn = PHIx + KD3 * (0.30 – PHIx) * (DENSMAgc / KD1 – KD2)
Where: KD1 = 1.00 for English units KD1 = 1000 for Metric units KD2 = 2.65 for Sandstone scale log KD2 = 2.71 for Limestone scale log KD3 = 1.80 for Sandstone scale log KD3 = 2.00 for Limestone scale log
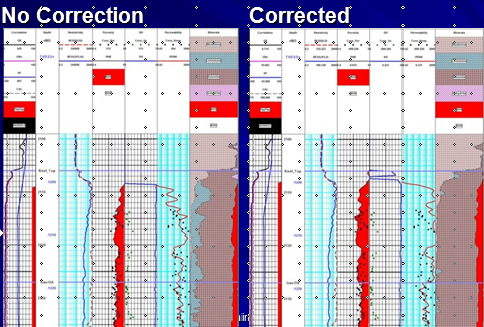
Density Neutron Complex Lithology Crossplot - Gas zones with NO crossover. Enter shale corrected data and then slide data point to the right until it reaches the line representing the matrix density of the reservoir - travel parallel to the nearest heavy black line. Do not use Dolomite scale log for this special case.
An illustration of how the points move under different conditions is given below.
Point A goes to A1, if CNL and DENSMA = 2710 (crossover)
Before the introduction of the photo-electric effect (PE) log
curve, it was easy for a log analyst to miss a gas filled dolomite
reservoir. The standard density neutron crossplot would show a
low porosity limestone, when in fact the zone is a medium porosity
dolomite. Since the density neutron looks like limestone (curve
separation is small) and the PE looks like dolomite (PE near 3.0),
this discrepancy is a red flag that a special case exists. Many
computer programs will not trigger gas corrections unless density
neutron crossover is present, and most programs do not contain
explicit algorithms to handle this special case.
13: E = (4 - (3.3 + 10 ^ (-5 * PHInc - 0.16)) 14: PHIxdn = (E * PHIdc + 0.754 * PHInc) / (E + 0.754)
Log data must be in Limestone Units for this Case. This option can be used instead of equation 4 as long as there is no gas crossover after shale corrections. It is slightly more accurate, but requires a computer or preprogrammed calculator. Some more modern CNL logs use alternate porosity transforms and are more linear at low porosities, so this fix may not be needed (rg. TNPH curve).
CASE 4: IF Archie or dual water model is to be used for water saturation, the following is needed: 15: BVWSH = (PHIDSH + PHINSH) / 2 (a constant for the zone) 16: PHIt = (PHID + PHIN) / 2 (one value for each layer)
CASE 5: IF zone is vuggy carbonate, calculate secondary porosity: 17: PHIsec = PHIxdn - PHIsc
|
|
||
|
Page Views ---- Since 01 Jan 2015
Copyright 2023 by Accessible Petrophysics Ltd. CPH Logo, "CPH", "CPH Gold Member", "CPH Platinum Member", "Crain's Rules", "Meta/Log", "Computer-Ready-Math", "Petro/Fusion Scripts" are Trademarks of the Author |
|||

|
||
| Site Navigation | POROSITY DENSITY NEUTRON CROSSPLOT COMPLEX LITHOLOGY MODEL | Quick Links |