|
 Cumulative and Average Reservoir
Properties
Cumulative and Average Reservoir
Properties
The reservoir volume and flow capacity per unit area are steps
toward finding total reservoir volume. Average values for comparing
the quality of reservoirs are also useful results from log analysis.
Pore volume (per unit area), hydrocarbon pore volume, flow capacity,
and the averages of core porosity, water saturation,
permeability, net pay, net reservoir, net sand, and gross sand
are called mapable properties, petrophysical properties, or reservoir
properties.
References:
1. Interpretation, Averaging and Use of
the Basic Geological-Engineering Data
D. Havlena, CIMM/PETSOC, 1966
2.
Dynamic Reservoir Data: Part II – Interpretation, Averaging
and Use of the
Basic Geological-Engineering Data.
D. Havlena, CIMM/PETSOC, 1968
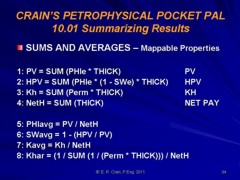
Cumulative Reservoir Properties
Pore
volume (PV).
5: PV = SUM (PHIe * THICK * PAYFLAG)
Hydrocarbon pore volume (HPV).
6: HPV = SUM (PHIe * (1 - Sw) * THICK * PAYFLAG)
Flow capacity (KH).
7: KH = SUM (Perm * THICK * PAYFLAG)
Average porosity.
8: PHIavg = PV / Hnet
Average water saturation.
9: SWavg = 1 - (HPV / PV)
Average permeability.
a. Arithmetic average:
10: Kavg = KH / Hnet
b. Geometric average:
11: Kgeo = (PROD (Perm * THICK)) ^ (1 / Ns)
c. Harmonic average:
12: Khar = Hnet / (SUM (1 / (Perm * THICK)))
Where:
Hnet = net pay thickness (ft or m)
HPV = hydrocarbon volume (ft or m per unit area)
Kavg = arithmetic average permeability (md)
Kgeo = geometric average permeability (md)
KH = flow capacity (md-ft or md-m per unit area)
Khar = harmonic average permeability (md)
Ns = number of samples in product
Perm = permeability (md)
PHIavg = average porosity (fractional)
PHIe = effective porosity (fractional)
PV = pore volume (ft or m per unit area)
SWavg = average water saturation (fractional)
THICK = individual layer thickness (ft or m)
COMMENTS:
Do
not use the following algorithm in thinly laminated shaly sands
- see alternate method shown below.
The
harmonic average most closely reflects radial flow into a borehole.
If equal sample intervals are used, this geometric formula becomes:
Kgeo = (PROD (Perm * INCR)) ^ (1 / INCR). where INCR = data
digitizing increment. It
does not give the same result as the previous version if layer
thicknesses are unequal.
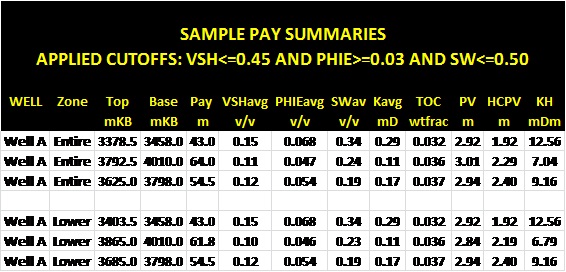
Sample net pay table with average
and cumulative mapable properties
NUMERICAL
EXAMPLE:
1. Assume three layers as follows:
Layer PHIe Sw Perm THICK (ft)
1 0.10 0.60 10 2
2 0.20 0.50 100 4
3 0.30 0.40 1000 6
Assume
all layers pass all cutoffs:
PV = 0.10 * 2 + 0.20 * 4 + 0.30 * 6 = 2.8 ft
HPV = 0.10 * (1 - 0.60) * 2 + 0.20 * (1 - 0.50) * 4 + 0.30 *
(1 - 0.40) * 6 = 1.56 ft
KH = 10 * 2 + 100 * 4 + 1000 * 6 = 6420 md-ft
Hnet = 2 + 4 + 6 = 12 ft
PHIavg = 2.8 / 12 = 0.233
SWavg = 1 - 1.56 / 2.8 = 0.443
Kavg = 6420 / 12 = 535 md
Kgeo = (10 * 2 * 100 * 4 * 1000 * 6) ^ (1 / 3) = 363 md
Khar = 12 / (1 / (10 * 2) + 1 / (100 * 4) + 1 / (1000 * 6)) =
228 md
If
equal sample intervals are used, (with INCR = 1.0),
Kgeo = 215 md
META/LOG ESP SPREADSHEET -- Log Analysis
Sums and Averages
This spreadsheet
provides a tool for analyzing and
summarizing log data in a consistent
format. It calculates porosity and
permeability averages, suns pore volume,
hydrocarbon pore volume, flow capacity,
and net pay with user defined cutoffs in
a table identical to that created by the
META/LOG "CORE" spreadsheet for log analysis,
making it easy to compare log analysis
results to core data.
Download this spreadsheet:
SPR-04 META/LOG ESP Advanced Log Analysis Oil Gas Metric and USA
Conventional Oil, Gas -- shale, porosity, lithology, saturation,
permeability, net pay,, productivity, reserves,
crossplots.
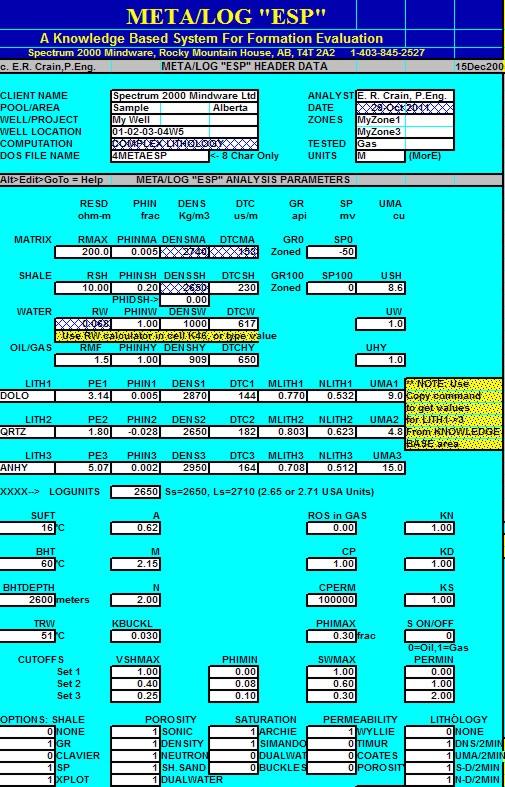
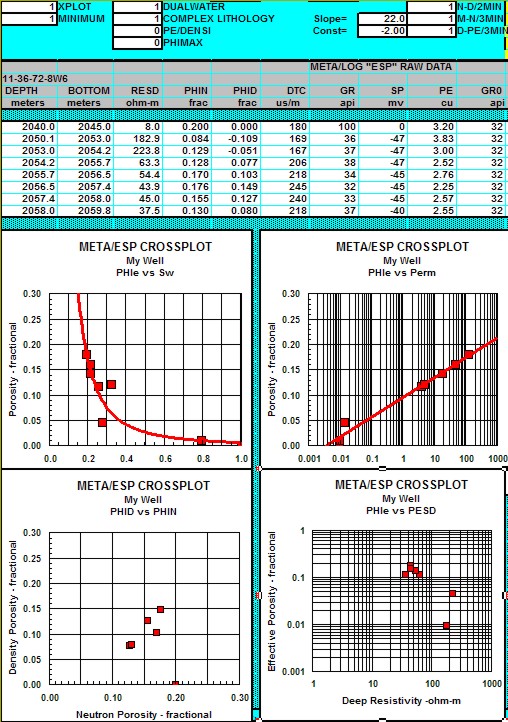
Exanple of META/LOG ESP input data and
crossplots. Intermediate calculations
are performed offscreen to the right.
The Summary Table (shown below0 is also
off to the right.
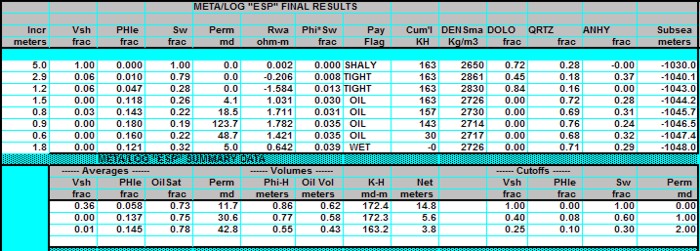
Individual Answers and Summary Table
from META/LOG ESP log analysis
spreadsheet. Compare to core analysis
results shown below.
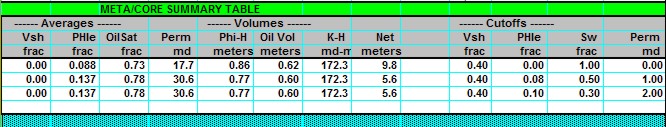
Summary Table from "META/COR". Compare
values to "META/ESP" log analysis
Summary Table shown above.
|