|
 Definition of FractureS
A fracture is sometimes called a
joint and, at the surface, are expressed as cracks or fissures
in the rocks. The orientation of the fracture can be anywhere from horizontal
to vertical. The rough surface separates the two faces, giving
rise to fracture porosity. The surfaces touch at points called
asperities. Altered rock surrounds each surface and may contain
solution porosity. Infilling
minerals may cover part or all of each surface . Minerals may fill
the entire fracture, converting an open fracture to a healed or
sealed fracture.
Fracture porosity is usually very
small. Values between 0.0001 and 0.001 of rock volume are typical
(0.01% to 0.1%). Fracture-related porosity, such as solution porosity
in granite or carbonate reservoirs, may attain much larger values,
but the porosity in the actual fracture is still very small.
 Fracture
porosity is found accurately only by processing the formation
micro-scanner curves for fracture aperture and fracture frequency
(fracture intensity). Reservoir matrix porosity and
permeability, including that attributed to fracture related
(solution) porosity, can be found by normal porosity calculation
methods. Fracture
porosity is found accurately only by processing the formation
micro-scanner curves for fracture aperture and fracture frequency
(fracture intensity). Reservoir matrix porosity and
permeability, including that attributed to fracture related
(solution) porosity, can be found by normal porosity calculation
methods.
Reservoir
simulation software that accounts for the fracture system is often
termed a “dual porosity” model. While this is strictly
true, it would be better to think of them as “dual permeability”
models, since the fracture permeability fed by the matrix or reservoir
permeability is far more important than the relative storage capacity
of the fractures and matrix porosity. A reservoir with only fracture
porosity is quickly depleted; a decent reservoir in the matrix
rock feeding into fractures will last much longer.
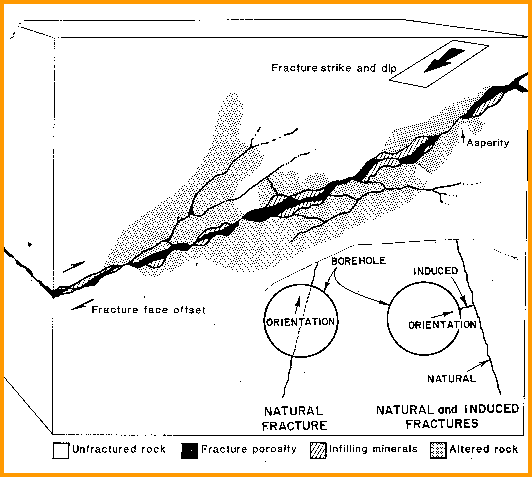
Fracture Porosity Definitions, showing fracture porosity (black) and
fracture related porosity (black dots),
Fractures are caused by stress in the formation, which in turn
usually derives from tectonic forces such as folds and faults.
These are termed natural fractures, as opposed to induced
fractures. Induced fractures are created by drilling stress or
by purposely fracturing a reservoir by hydraulic pressure from
surface equipment. Both kinds of fractures are economically important.
Induced fractures may connect the wellbore to natural fractures
that would otherwise not contribute to flow capacity.
Fracture
POROSITY And PERMEABILITY from APERTURE DATA
Quantitative prediction of porosity and permeability of fractures
relies on the fracture aperture, measured in millimeters, from
resistivity micro-scanner or observation of cores or core images.
1. PHIfrac = 0.001 * Wf * Df * KF1
The fracture permeability equations are attributed to Dr Zoltan
Barlai:
2: Kfrac = 833 * 10^11 * PHIfrac^3 / (Df^2 * KF1^2)
3: Kfrac = 833 * 10^5 * PHIfrac * Wf^2
4: Kfrac = 833 * 10^2 * Wf^3 * Df * KF1
Where:
KF1 = number of main fracture directions
= 1 for sub-horizontal or sub-vertical
= 2 for orthogonal sub-vertical
= 3 for chaotic or brecciated
PHIfrac = fracture porosity (fractional)
Df = fracture frequency (fractures per meter)
Wf = fracture aperture (millimeters)
Kfrac = fracture permeability (millidarcies)
Note:
Equations 2, 3, and 4 give identical results.
NUMERICAL EXAMPLE
Df = 1 fracture per meter
Wf = 1.0 millimeters
PHIfrac = 0.001 * 1 * 1 = 0.001 fractional (0.1%)
Kfrac = 833 * 100 * 1^3 * 1 * 1 = 83300 millidarcies
Df = 10 fractures per meter
Wf = 0.1 millimeters
PHIfrac = 0.001 * 10 * 0.1 = 0.001 fractional (0.1%)
Kfrac = 833 * 100 * 0.1^3 * 10 * 1 = 833 millidarcies
These
examples represent well fractured reservoirs. You can see that
the volume of hydrocarbon is very small but the permeability is
very high.
Downlad this spreadsheet to make the calculations easier.
SPR-29 META/LOG FRACTURE POROSITY and PERMEABILITY CALCULATOR
Calculate fracture porosity and fracture permeability
from fracture aperture - Zoltan Barlai
models
Calculating Fracture APERTURE FROM IMAGE LOG DATA
There are two methods that can be used to determine fracture
aperture from image logs. One is to use image processing
techniques to "count pixels". By scanning an image and counting
the darkest black pixels, and a little judicious use of
geometry, the volume of the fractures seen in the image can be
estimated. The method is very sensitive to the trigger
level used to descriminate the fracture from surrounding
borehole roughness or breakouts. Overestimation is a common
outcome. The approach is cheap, easy, and often wrong.
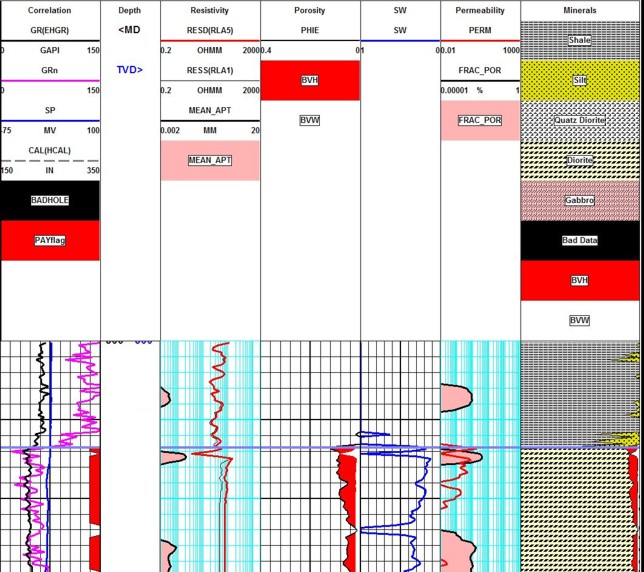
Conventional petrophysical analysis with fracture aperture (Track 2
- shaded pink) and fracture porosity (Track 4- shaded oink) both
derived from image analysis methods. Note the low resistivity spike
on the fracture in the center of the log section, caused by mud
filtrate invasion into the fracture.
A more
accurate approach is based on finite element analysis of the
resistivity image data. as described in
"Fracture Apertures from
Electrical Borehole Scans", S. M. Luthi and P. Souhaite,
Geophysics, Vo1.55, No.7, July, 1990, pp.821-833. The math is beyond
me and beyond the scope of this article. The method is available
from some service companies.
An
example of a fracture aperture log from a program called Frac-View
is shown below.
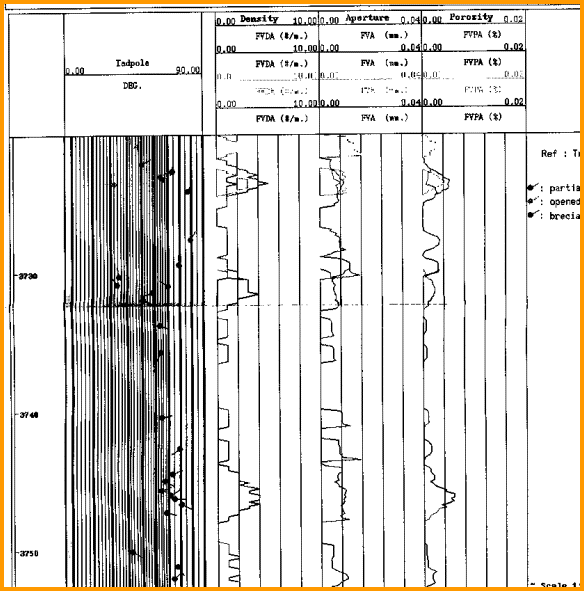
Fracture frequency, aperture, and porosity log in a
fractured granite reservoir derived from
a resistivity image log. The most accurate method is based on
the measured resistivity curves on the image log. The pixel count method is much less accurate
because of borehole erosion and breakouts.
|