1. Relatively low shale content as seen on the gamma ray log or the SP log, combined with some porosity on the sonic, density or neutron logs. 2. Mud cake buildup as seen on the caliper log. (See top left illustration). 3. Separation between the deep induction (or any deep resistivity device) and the shallow resistivity device as in the top right illustration. Separation is seen when two logs do not read roughly the same resistivity value, because fluid from the mud has invaded the formation. This causes a different resistivity to occur close to the borehole wall compared to deeper in the formation. This method is not applicable in high resistivity due to borehole effect. 4. Positive separation on a microlog, if the log is available, is another indicator of permeability. Positive separation means that the dotted curve (R2) reads higher resistivity than the solid curve (R1). 5. Porosity of any significant amount usually indicates permeability. However, the amount of permeability cannot be directly related to the porosity without some outside knowledge, such as core analysis data. In the low porosity - permeability range the logarithm of permeability is often proportional to porosity, and useful crossplots of this data transformation can be made. 6. The length of the transition zone, if it can be identified, is an indicator of permeability. The longer the transition, the lower the permeability.
|
|
||
|
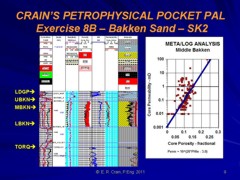
Page Views ---- Since 01 Jan 2015
Copyright 2023 by Accessible Petrophysics Ltd. CPH Logo, "CPH", "CPH Gold Member", "CPH Platinum Member", "Crain's Rules", "Meta/Log", "Computer-Ready-Math", "Petro/Fusion Scripts" are Trademarks of the Author |
|||

|
||
| Site Navigation | PERMEABILITY CRAIN'S RULES FOR VISUAL ANALYSIS | Quick Links |