|
 Analyzing
Dipmeters with Tangent Diagrams
Analyzing
Dipmeters with Tangent Diagrams
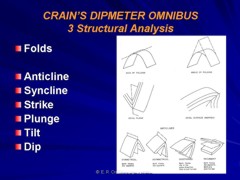
Some structural analysis problems are easier to visualize when
transformed into a single two dimensional domain instead of several,
as arrow and SCAT plots do. The two methods available are tangent
diagrams and stereonets. Tangent diagrams were described very
well by C.A. Bengtson in Geology Vol 8 No 12 (1980) in "Structural
Uses of Tangent Diagrams", reprinted in Geobyte, Mar 1989,
along with an interactive computer program written by Robert Elphick.
Tangent
diagrams, such as the example shown below, are special
polar coordinate graphs that provide convenient graphic solutions
for many problems of structural geology. Direction of dip is read
at the circumference, and angle of dip is read from the concentric
circles. The radius of each circle is proportional to the tangent
of the angle of dip. High dips, therefore, plot farther from the
center than low dips. The distinctive feature of this method of
display is that planes can be represented by vectors, in a manner
similar to stereonets, although tangent diagrams are more easily
applied than stereonets.
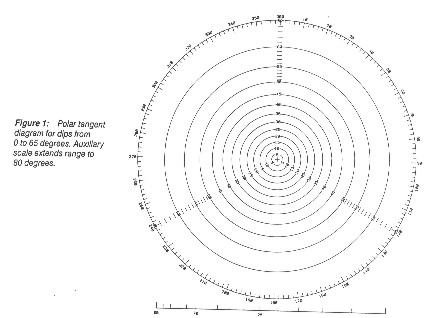
Polar plot for tangent diagram
Shown below is a block diagram of a sloping plane, illustrates the basic
principle of the tangent diagram. Line B1 is a horizontal line
in the direction of true dip, and B2 is another horizontal line
making an angle with B1. The trigonometric relations on this drawing
demonstrate that the tangent of apparent dip in any direction
is equal to the tangent of the true dip times the cosine of the
angle between the directions of true dip and apparent dip.
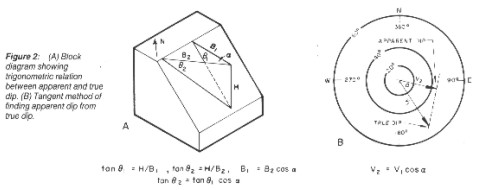
Tangent diagram for homocline
The problem of finding apparent dip from true dip can be resolved
vectorially on a tangent diagram, shown at right, below:
1. plot V1, the true dip, as a vector from the origin with length
proportional to the tangent of the angle of dip.
2. draw a line V2 in the direction of the apparent dip.
3. from the end of V1, draw a line perpendicular to V2.
4. read the apparent dip from the intersection of the two lines.
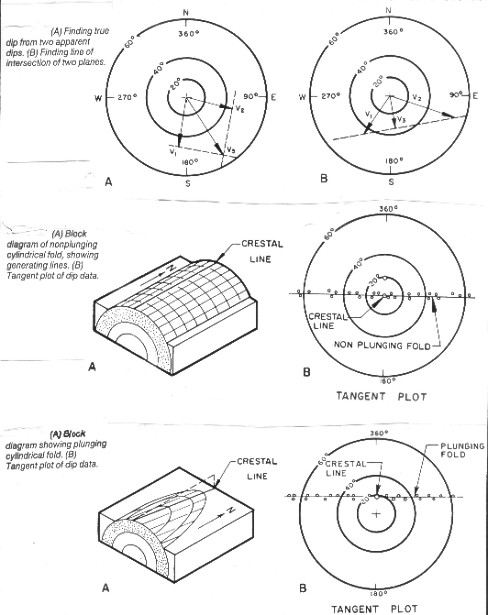
Tangent diagrams for finding true dip and strike
of folds
The illustration at top left shows how the tangent diagram is used to find
true dip from two apparent dips:
1. plot V1 and V2, the two apparent dips.
2. draw perpendicular lines through their end points.
3. read the true dip, V3, from the intersection of the perpendicular
lines.
If
two planes intersect, they have equal apparent dips in the vertical
plane containing their line of intersection. The illustration at top
right shows how this principle is used to find the line of intersection
of two planes.
1. plot V1 and V2, the true dip vectors of the two planes.
2. connect the end points of the two vectors with a straight line.
3. draw V3, the perpendicular from the origin to the straight
line. This vector gives the bearing and plunge of the line of
intersection of the two planes.
The
lines of intersection of planes tangent to the bedding on the
same or opposite flanks of an ideal cylindrical fold are parallel
to the crestal line. Dip measurements obtained at random locations
on such a structure will fall on a straight line when plotted
on tangent diagrams, as exemplified by the dashed line in in the middle
illustration above. The line for non-plunging folds passes through
the center of the plot, plunging folds to one side (bottom
illustration). Cylindrical folds plot as straight lines and conical
folds as curved lines (see below).
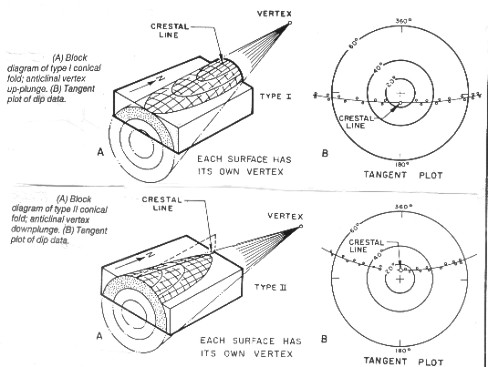
More tangent diagrams for folds
|