|
 Analysis of Dipmeter Data
- StructurE
Analysis of Dipmeter Data
- StructurE
The traditional analysis of dipmeters makes use of patterns seen
on the arrow plot, augmented by those seen on azimuth frequency
plots.
An
overview of the thought processes were described by E. L. Bigelow
in "Making More Intelligent Use of Dipmeter Information",
published in The Log Analyst in five parts beginning January 1985.
The flowchart below, taken from that paper, demonstrates the complexity
and interrelated nature of the data acquisition. processing, and
analysis problem. A review of Mr. Bigelow's paper will provide
many insights not covered in this Chapter, due to lack of space
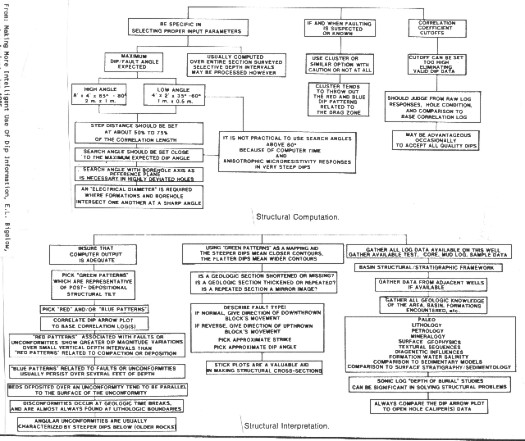
Flow chart for dipmeter processing decisions
(upper), interpretation
(lower) for structural analysis
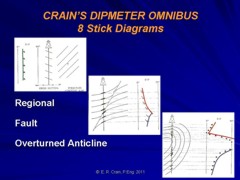
Structural
analysis begins with a review of the arrow plot. Dips fit one
of five general patterns, each defined by the color of the pencil
used to mark them:
GREEN
PATTERNS: nearly constant dip and direction, representing regional
dip, sometimes called structural dip.
RED
PATTERNS: increasing dip with depth, representing drape, down
dip thickening,
differential compaction, drag on faults, or folding.
BLUE
PATTERNS: decreasing dip with depth, representing drag on faults
or folding.
BLACK
PATTERNS: abrupt change in dip and/or direction, representing
unconformities, fault planes, or erosional boundaries between
stratigraphic units.
CIRCLED
PATTERNS or YELLOW PATTERNS: random dip angles or directions indicates
bad hole conditions, contorted bedding, fractures, slumping, or brecchia, sometimes associated with fault planes.
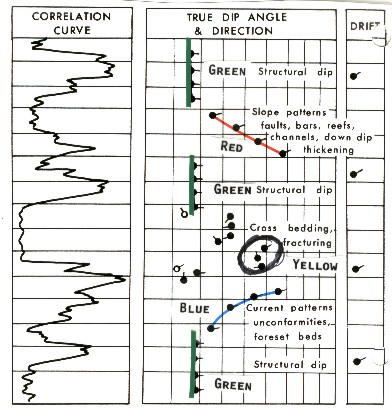
Colour patterns for dipmeter interpretation
The
color assignments, namely green, red, blue, black, and yellow,
are purely arbitrary but have become an industry standard by common
usage. Appropriately colored pencils or ink markers are used to
join dip arrows to emphasize the patterns. The five patterns are
illustrated schematically above. The features associated
with each pattern are listed on the illustrations.
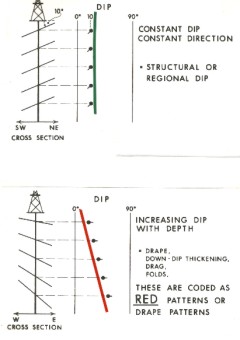
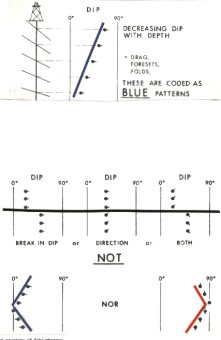
Dipmeter pattern colour codes with stick diagrams
All
but black patterns should have roughly constant dip direction,
or else they are not real patterns. An exception is a pattern
that passes through zero or ninety degrees, where dip direction
will reverse.
To
begin analysis, start at the top of the log (or somewhere above
the zone of interest) and draw in the green, red, blue, black.
and yellow patterns, in the order listed. Be careful not to cross
a major change in dip direction with one of these patterns, unless
it is an exception as described above. Remember that such a change
in direction is normally a black pattern.
Join
arrows which are fairly close in depth. The end of a blue pattern
can be the beginning of a red pattern and vice versa. Not all
the results need to be included in every pattern. You may decide
some are due to noise, rough hole, or minor stratigraphic events
embedded in a larger structure.
In
the example below, the top half of the log shows a trend
of dips at 9 degrees downward to the east - a GREEN pattern. The
horizontal line at "A" indicates a break in trend -
a BLACK pattern. This is followed by another GREEN pattern, indicating
regional dip of 5 degrees to the west south west below an unconformity
at depth "A". This is followed by a RED pattern indicating
drag above a fault. The fault plane is at or slightly above point
"C". This is followed by the reverse drag on the down
thrown block - a BLUE pattern, lying above another unconformity
at point "D".
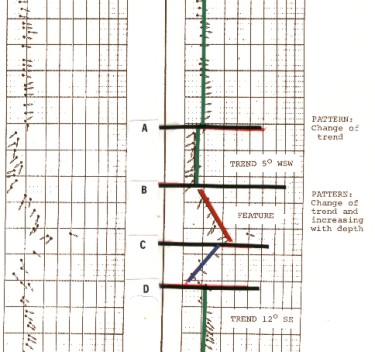
Example of colour coded dip patterns
Although
we have described a plausible interpretation in the above description,
it may not be the only interpretation. However, it is not necessary
or even practical to analyze the meaning of all the patterns at
this stage - more than one interpretation is possible for all
patterns. For example, the event at "C" could be a stratigraphic
feature or another unconformity. We need to look at the open hole
logs and other well data.
For
structural interpretation, you may have to ignore stratigraphic
dips. This involves drawing the patterns through dissenting dips
in the sandstone layers. This is called macro-colouring as opposed
to micro-colouring, used in stratigraphic analysis.
For
stratigraphic work, do not join points across a dissenting dip.
The dissenting dips are the clues to stratigraphic changes. Join
arrows of about the same dip direction. The greater the dip magnitude,
the more similar the azimuths should be. Conversely, when very
small dips are considered, the azimuth can vary up to 90 degrees.
Keep
the scale of features in mind. Structural features may encompass
hundreds or thousands of feet of data. Stratigraphic features
may be superimposed on the structural patterns, and encompass
only a few feet to a few hundred feet. However, drape over reefs
and differential compaction may persist over several thousand
feet, and these features are associated with stratigraphic traps.
Red patterns associated with faults and unconformities tend to
show greater variations in dip magnitude over smaller vertical
intervals. Blue patterns associated with sedimentary structures
are usually short (up to a few feet on the vertical scale), whereas
the patterns that are a reflection of faults and unconformities
generally persist over much longer intervals.
|