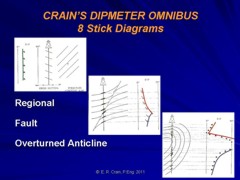
|
 Choosing
and Using Regional Dip
Choosing
and Using Regional Dip
Regional dip, often called structural dip, is chosen in zones
where dip angle and direction are consistent, with a minimum of
scatter. These are GREEN patterns. Due to the
roughness of the borehole, and statistical variations in the correlation
measurements, even a zone with zero dip will show some scatter.
In particular, dip direction may appear to fluctuate wildly when
dip is near zero.
Regional
dip may not be easy to find. In thick sandstones, there may be
too many stratigraphic features, and in thick carbonates there
may be no bedding or too many fractures. Therefore, shale sections
should be preferred for the selection of structural dip. If there
is not much shale, choose the minimum consistent dips in the sands.
However,
shale sections do not always exhibit a regular dip. The mode of
deposition as well as post-depositional slumping or fracturing
may induce erratic dips. Bad or rough hole will also cause dips
in shale beds to be scattered. A statistical approach may then
be needed to determine structural dip, and local experience is
the best guide. Here is a case for using the modified Schmidt
plot or the frequency azimuth plot to help find regional dip.
It
is essential to subtract the structural dip (by means of dip vector
rotation), preferably by having a regional dip removed arrow plot
created in the computer. Indeed, a blue pattern may become a red
one and vice versa after subtraction of the general trend. The
term "absolute red" and "absolute blue" are
used to describe patterns which are distorted by regional dip.
 If,
after drawing the patterns, you find regional dip to be greater
than about 4 degrees in any zone, you should have the log re-displayed
with dip removed. Obviously a different amount of dip will have
to be removed from different geologic sections. Pick these values
for each section from your green patterns between each major break
defined by the black patterns. If,
after drawing the patterns, you find regional dip to be greater
than about 4 degrees in any zone, you should have the log re-displayed
with dip removed. Obviously a different amount of dip will have
to be removed from different geologic sections. Pick these values
for each section from your green patterns between each major break
defined by the black patterns.
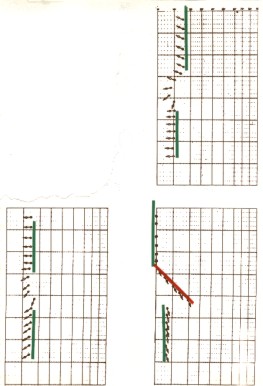
Effect of regional dip removal on pattern shape

The
illustration at the right shows three dipmeter presentations of the same structure.
Each has a different regional dip superimposed on the red pattern,
which is only visible in one of the illustrations. This emphasizes
the absolute necessity of working with dip removed data. You will
have to re-analyze the dip removed log for red and blue patterns.
You
will use these ONLY to identify the nature of the structural features
and the direction to thicker pay zones. The true dip and direction
of beds is still contained on the original log, and it is still
used for mapping structures and looking for the next drilling
location.
A
dipmeter log should always be correlated with the rest of the
open hole logs when the patterns are being drawn. A computed lithology
log is especially helpful to prevent drawing silly patterns which
cannot be supported by the obvious lithology. For instance, it
would make little sense to unite in the same blue pattern two
arrows belonging to different lithological units. A good well
history and the formation tops should also be at hand, since most
major unconformities will occur at one of these points.
Some
of the modern dipmeter presentations, such as SYNDIP, GEODIP.
and STRATIM will make life much easier. However, they are only
available on modern logs, and even then, may not have been run
(to save money), or may not be in the well file or in the public
domain. These logs are aids, not answers - be sure the aid is
properly processed and makes sense in light of other known data.
On older wells, you will have to create your own equivalent aids
by laying out and possibly analyzing the other open hole logs.
The minimum requirement is a gamma ray or SP log at the same depth
scale as the dipmeter arrow plot.
|