|
 Case
Histories of Structural Analysis
Case
Histories of Structural Analysis
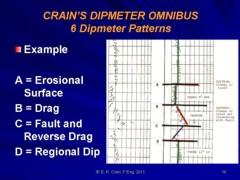
In addition to the Classic Examples, review of case histories
often assists in consolidating analysis rules for structural interpretation
of dipmeters. A number of case histories have been gleaned from
the literature and the author's files to illustrate some real
life examples. Because of the inordinate detail available on many
logs, most of these examples have been hand drafted by the original
authors for clarity.
Unconformity
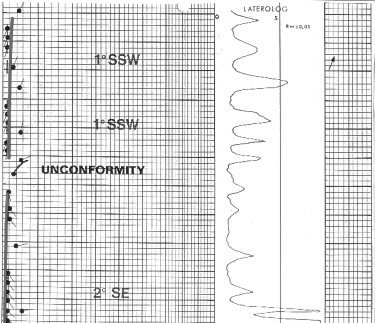
An angular unconformity is the easiest feature to see in a dipmeter
analysis. Pick regional dips in shale zones and draw in green
patterns for each. The level where two different green patterns
meet is an unconformity. Either dip angle, dip direction, or both
will change at an unconformity. Check other log curves for lithology.
If a sand separates two different green patterns, the unconformity
could be at the top or the bottom of the sand. Usually the formation
age will help determine which to choose.
Unconformity
 Normal Fault with Rollover and Drag
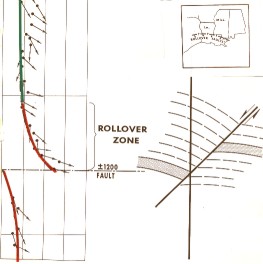
This is an example of a South Louisiana fault exhibiting rollover
on the downthrown side. As the fault is approached from the downthrown
side, the dip starts to increase. This increase continues until
a maximum dip of 25 degrees is reached. Experience has shown that
this maximum dip is recorded within 10 feet of the fault plane
on the downthrown side. In this example, the direction of the
maximum dip is ESE. Since the direction of the maximum dip is
toward the upthrown block, and is perpendicular to the strike
of the fault, this fault is upthrown to the ESE and strikes NNE-SSW.
A small amount of drag is noted in the upthrown block, but it
is minor compared to the downthrown rollover zone.
 Normal Fault with Rollover and No Drag
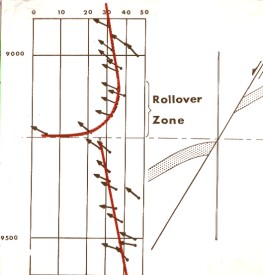
This is another South Louisiana example with rollover present
on the downthrown side of the fault. However, in this case the
fault and steeply dipping beds are dipping in the same direction.
So, instead of the rollover zone dips adding to the structural
dip, they actually cancel the strong northwesterly structural
dips. Instead of the familiar maximum dip near the fault plane,
a minimum amount of dip is now noted. As soon as the upthrown
block is penetrated, structural dip is immediately recorded. This
type of fault is sometimes found near piercement salt domes. If
regional dip above the fault is subtracted, the apparent blue
pattern (decreasing dip with depth) turns into a red pattern.
Rollover causes a reversal of dip direction if upper beds are
made horizontal by dip removal.
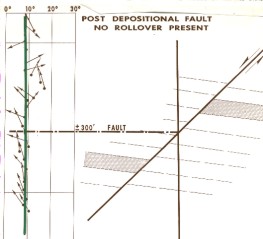 Normal Fault with No Rollover and No Drag
Some post-depositional faults may not be located by the dipmeter.
No distortion is present near the fault plane, so structural dip
is recorded by the dipmeter right across the fault plane. In high
resolution or stratigraphic arrow plots a short zone of random
dip may occur, but may be interpreted as a function of sand body
deposition.
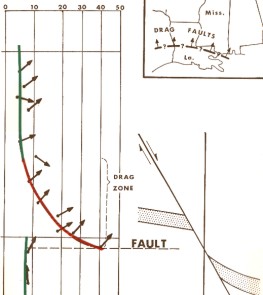 Normal Fault with Drag and No Rollover
Here is a normal fault from Mississippi which has drag instead
of rollover on the downthrown side. The pattern of dips is the
same as that found near faults with rollover, but the direction
of the highest dip is toward the downthrown block. In this example,
the direction of the maximum dip (41 degrees) is NE, so the fault
is downthrown to the NE and strikes NW-SE.
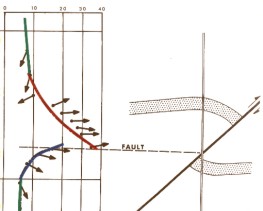 Thrust Fault with Rollover and Drag
This example shows a thrust fault. Again we see a dip pattern
similar to that found around a normal fault. The maximum distortion
around a thrust fault is in the overthrust block, and the direction
of the highest dip is in the direction of overthrust. Since the
maximum dip shown in this example is 35 degrees East, this fault
is overthrust to the East and strikes N-S. Some drag is noted
in the downthrown block, but it is not as strong as that recorded
in the overthrust block.
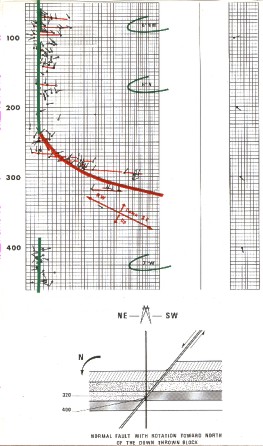 Normal Fault with Rotation
Structural dip is indicated by the green pattern. Below 400, it
is down to the west at about 7 degrees magnitude. Near 100, its
magnitude is at about 6 degrees, the direction being more northwesterly.
Between 225 and 325 is a strong red pattern of northeast dips.
No dips could be computed between 325 and 400. This red pattern
is probably the result of drag in the downthrown block along a
northeast dipping normal fault. The fault plane strikes northwest-southeast.
Some rotation of the downthrown block at the time of movement
is evidenced in the more northerly trend of the structural dip
around 100.
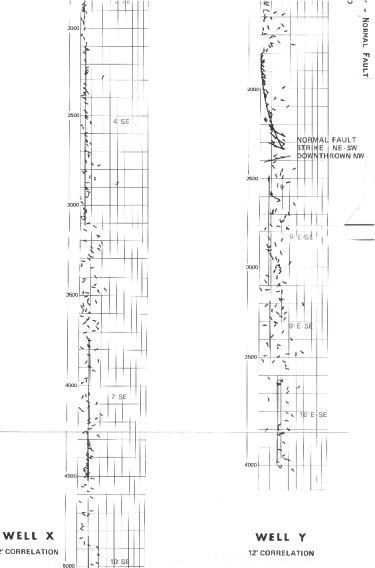
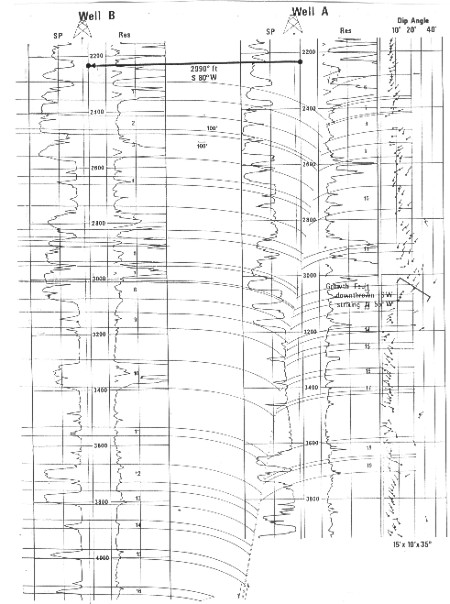
Normal Fault with Correlation to Unfaulted Well
In
Well X, the long correlation interval (12') shows clearly the
structural dip. It increases from near zero at 1,200 feet to 7
degrees at 4,600 feet,
always in a southeasterly direction. In Well Y, which is east
of Well X, the long correlation interval plot also shows the structural
dip clearly,
indicating 3 degrees east-southeast at 1,100 feet increasing to
16 degrees east-southeast at 4,000 feet. One conclusion that could
be drawn is that structural dip in this area is southeasterly,
and that a given horizon in Well Y will be structurally lower
than the same zone in Well X. However, the main sand bodies in
Well X occur below 3,100 feet whereas the corresponding sands
in Well Y are below 2,800 feet.
Normal Fault with Correlation to Unfaulted Well
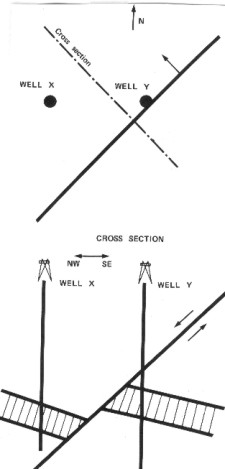 Between
1,800 and 2,300 feet in Well Y, a reversal of dip direction is
evident, increasing to a high angle to the northwest at 2,300
feet. This is a strong red pattern. It is followed by a blue pattern
of short duration. This
characterizes a normal fault striking NE-SW, downthrown to the
northwest, crossing the borehole at 2,300 feet. The presence of
this fault explains the apparent inconsistency between the
structural dip interpretation and the correlation between Wells
X and Y. Between
1,800 and 2,300 feet in Well Y, a reversal of dip direction is
evident, increasing to a high angle to the northwest at 2,300
feet. This is a strong red pattern. It is followed by a blue pattern
of short duration. This
characterizes a normal fault striking NE-SW, downthrown to the
northwest, crossing the borehole at 2,300 feet. The presence of
this fault explains the apparent inconsistency between the
structural dip interpretation and the correlation between Wells
X and Y.
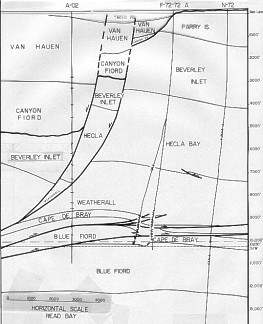 Complex Overthrust Faults
This example shows data from several dipmeters through a carbonate/shale
sequence, controlled by seismic mapping. The complex overthrusts
seen on seismic are confirmed by correlation of lithology based
on open hole log analysis, sample description, and palynology.
Hash marks on the well tracks show key dips only and indicate
major bedding attitude. Whipstock and offset decisions were influenced
by dipmeter data as the prospect was chased westward, with much
help from seismic and imaginative structural geology.
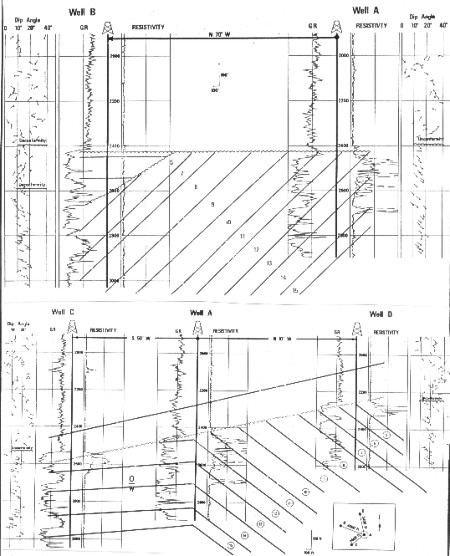
Correlation in Thick Sand Sequence
In thick sand shale sequences, there may be little evidence from
curve shapes to aid zone to zone correlation. Regional dip superimposed
on well cross sections will assist. Individual sand units may
not be continuous across the section, but the correlation lines
give clues to possible time stratigraphic sequences.
Correlation in Thick Sand Sequence
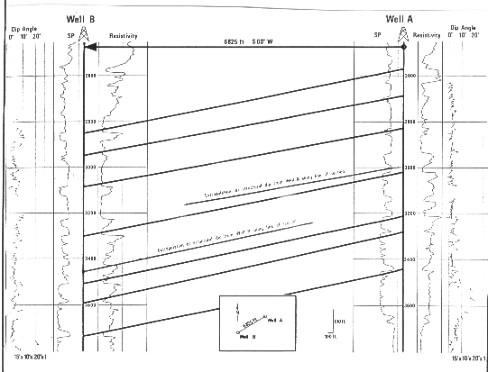
Angular Unconformity
Dip angle and direction data show two unconformities in Well B
and only one in Well A. The major unconformity is nearly horizontal
in Section A-B, but dips 3 degrees SSW on Section C-A-D. The angular
unconformity controls trapping in all three wells, with a common
oil-water contact in Wells A and C, and a higher one in Well D.
Regional dip again helps to correlate possibly continuous sand
bodies.
Angular Unconformity
Growth Fault in Thick Sand Sequence
A growth fault crosses Well A at 3040 feet, down thrown to SW
and striking N 55 W. Evidence is strongest from the change in
direction of dips at that depth. Correlation of numbered sands
is from multi-well mapping and not solely from the data in this
illustration.
Growth Fault in Thick Sand Sequence
Overturned Anticline
This
illustration shows a microscanner image through what is claimed
to be an overturned anticline. However, the dimensions are very
small and the fold very, very tight, so it is possible that the
shape is merely wedge shaped bedding tilted on edge or an
angular unconformity. Since a fault plane is not visible, a
fault interpretation cannot be supported.
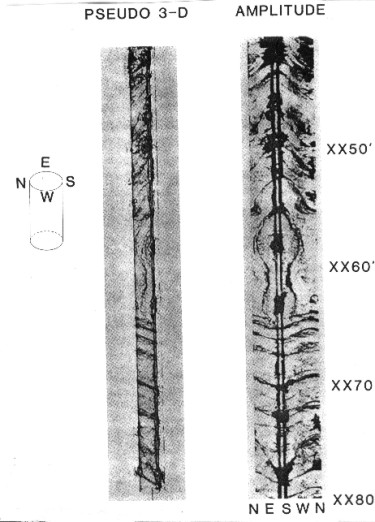
Overturned Anticline
|