These are the elements found in most common minerals, such as quartz (SiO2), calcite (CaCO3), dolomite (Mg Ca CO3), shale (Si Al Fe O2). Along with thorium, potassium, and porosity derived from other logs, the elemental yields are transformed into mineral volumes by a least squares inversion, attempting to use up all the elements found with the least error. This process has an infinity of possible answers and sometimes fails to give rational results. The natural gamma ray spectral log is a passive device that filters the natural gamma rays emitted by a formation into three components - potassium (K), uranium (U), and Thorium (Th). These logs are sometimes called KUT logs. The thorium and potassium curves can be used together or in combination with PE, DENSma, or any other lithology indicator described earlier to determine two or three mineral models. Rather than repeat the equations here, the reader is encouraged to re-write the three mineral model given earlier for Uma-DENSma, substituting PE, K, or Th/K as desired. Crossplots shown below can be used to visualize many potential mineral combinations. In most cases, shale intervals can be located from the total gamma ray, SP, or density neutron separation. In radioactive dolomites, this is not possible, since the GR responds to the uranium in the dolomite, the SP is flat due to the nature of the SP in carbonates, and the density neutron separation is due to the dolomite, not necessarily shale. The PE value of most shales is similar to dolomite, so PE is no help either. Radioactive dolomite looks exactly like shale on conventional logs. In this situation, the natural gamma ray spectral log will provide information on the thorium, potassium, and uranium content of the rock. If thorium and/or potassium are low, and uranium is high, then the rock is not shale. Other data such as PE, density, and neutron are then used to define the porosity and rock type. However, if thorium or potassium is high, with or without uranium, then some shale should be suspected, and accounted for. Radioactive limestones also exist. These are less ambiguous as the density neutron separation is small and PE high. These characteristics are not shale indicators. Sandstones also may be radioactive due to potassium in feldspar. Low uranium content and other log data should define this situation. The thorium curve is used as a shale indicator and the density neutron complex lithology crossplot model is used for porosity calculations. Some reservoirs become
radioactive at the well bore due to precipitation of uranium
during oil production. This higher radioactivity compared to the
original open hole logs can be confusing during workover or
production logging operations. The uranium curve will help
explain the problem.
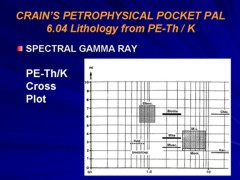
The thorium/potassium ratio is another method of visually identifying some rocks. In decreasing order, the Th/K ratio list is as follows: This ratio is illustrated graphically below. A neat tool developed by Yalcin Pekiner for finding clay type from thorium potassium ratio can be found HERE.
Where:
|
|
||||||||||||||||||||
|
Page Views ---- Since 01 Jan 2015
Copyright 2023 by Accessible Petrophysics Ltd. CPH Logo, "CPH", "CPH Gold Member", "CPH Platinum Member", "Crain's Rules", "Meta/Log", "Computer-Ready-Math", "Petro/Fusion Scripts" are Trademarks of the Author |
|||||||||||||||||||||

|
||
| Site Navigation | MINERALOGY CLAY TYPE PE TH K and DENS UMA CROSSPLTS | Quick Links |