Determination of mineral rock composition is an important intermediate task of formation evaluation. In early days of well log analysis, only porosity, water saturation and sometimes permeability were calculated from the logs. Later on, significance of solid rock component distribution was recognized; while introduction of new well logging instruments enabled the more accurate assessment of lithology.
•
Effective porosity
•
Effective porosity
In typical circumstances, the number of rock components present in the formation exceeds the number which can be reliably determined. (It is typically not more than five, while in complex lithology the total number of applied mineral constituents may reach 15 or 20.)
In the case of a full log suite, the following models could be applied:
•
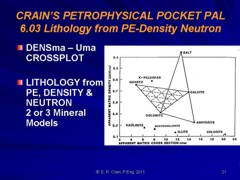
Porosity, calcite, dolomite, silt, kaolinite
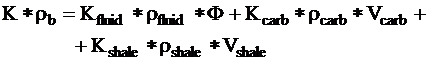
A great number of well logs are measured in recent wells. For the task of lithology determination, only those are involved which are sensitive for the mineral composition but are not sensitive for other conditions such as fluid saturations. The mathematical relationships connecting the rock composition to the well log measurements are called response functions.
Bulk density:
Potassium content:
where
Remarks: (1) Some well log measurements are related to the mass fractions of the rock components rather than to the volume fractions. In their response functions, volume fractions are multiplied by the specific density of the component. Further examples are: gamma ray, photoelectric effect, Thorium content.
(2)
Response functions may or may not be linear; example of the latter
is the Raymer equation of acoustic sonic travel time. Similar is the
case of SP (spontaneous potential). It means that the software
should be prepared for the handling of systems of nonlinear
equations.
It can be observed in the examples of response functions that some parameters other than the volume fractions of minerals are involved. They are generally the specific values of the measured quantity for the rock component, e.g. the specific density. These are supposed to be known before the evaluation. They are called "zone parameters" because their value is constant over a depth interval which covers (roughly) a geological formation.
• In publications of well logging companies, handbooks etc. these parameters are published as glossary data; e.g. specific density of different minerals is well known from the literature. • The study of the measured well logs themselves (in the form of hard copies, crossplots etc.) can reveal some parameters. E.g. layers where shale content is near to 100 % can suggest the zone parameters of the "shale" rock component. • Log analysis can be calibrated to cores if they exist. In general, geological descriptions based on cores and drill cuttings reveal the minerals existing in the formation. Comparison of core porosity measurements with porosities computed from well logs may indicate that zone parameters of the "porosity logs" (density, neutron, sonic) are not correct. • In field-wide studies where several wells are measured in roughly the same period by the same logging company, experience from interpretation of one well can be transferred to another well regarding selection of rock components, rock models, zone parameters etc.
•
There is a feedback between zone parameters and the analysis. If
there is a systematic difference between measured values and
theoretical response values of a well log, it may be reduced by
modifying zone parameters.
Quantitative analysis of lithology in a well is carried out in a depth interval which is important regarding the hydrocarbon production; that is generally the potential reservoir interval and some adjacent intervals. It may be homogeneous in respect of lithology, but often it covers more than one geological formations which are distinctive in age, mineral composition etc. Rock components, rock models and zone parameters should be set up differently in these formations.
In deterministic systems of interpretation the number of unknown volumetric fractions equals the number of equations (including the log response equations and the material balance equation). Validity of the result should be checked, e.g. the equations can yield negative volume fractions which should be avoided .
Deterministic interpretation in a sequential way is the traditional (conventional) way of lithology determination. The volume fraction of one component is determined from one well log. (The response function of that well log is simplified so that only the volume fraction of that component is involved as the unknown quantity.) The second component is determined from another well log measurement; in its response function the volume fraction of the first component may be already involved. In a similar way at each step a new component is determined by using the response function of a well log measurement and volume fractions of components computed in previous steps. The last component is computed from the material balance equation.
In the second step (where Vshale is already known) porosity is
computed from the neutron porosity measurement:
In the last step the material balance equation yields the volume fraction of sand:
Deterministic interpretation by solving a system of equations is an alternate to sequential methods.The response functions (plus the material balance equation) can be treated as a system of equations with the volume fractions of rock components as unknowns. This system of equations can be solved by appropriate mathematical methods. Advantages of this approach are: • All unknown volume fractions are computed simultaneously, so the complete forms of response functions are used (e.g. in the previous example effect of porosity on gamma ray measurement is not ignored). • Handling of constraints on the accepted range of volume fractions is more consistent. For example substituting zero values for negative volume fractions will lead us to more equations as unknowns so it leads us to the statistical interpretation.
•
Cumulative addition of errors associated to the sequential way is
reduced.
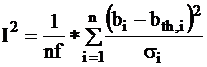
In the deterministic algorithms, the number of equations (with material balance) equals the number of unknown rock components. In statistical interpretation the number of equations exceeds the number of unknowns. It means that the number of well log measurements is at least as large as the number of rock components but generally larger. It means that the system is mathematically over-determined: no exact solution exists which satisfies all the equations.
• A measure of quality called incoherence is defined for the evaluation of each approximate solution for the system of equation; • A mathematical optimization problem is defined: find the set of volume fractions which gives the optimum value of the incoherence; • Constraints on the solution (upper and lower bounds on the volume fractions) are treated by including penalty terms in the quality indicator if the constraints are violated. • Advanced methods of mathematics are applied for the solution of the optimization problem; it yields a set of volume fractions of minerals as well as the value of incoherence.
• Environmental effects: borehole enlargement and rugosity, interaction with drilling mud etc.; • Errors in the principle of measurement (statistical nature of radioactive radiation); • Errors in depth matching and effects in difference of depth of investigation of the different well logging instruments; • Further on, the selection of rock models and zone parameters is burdened with errors.
where bi: measured value of the i-th well log; bth,i: value computed from the response function of the i-th well log, called answer; si: standard deviation of error for the i-th measurement. nf: degree or number of freedom which equals: number of well logs + 1 - number of unknowns
In a simple rock development, it is sufficient to apply a single rock model like the three-component sandstone model of porosity, sand (quartz) and shale. In real situations further minerals or other lithology components accumulate in the rock such as calcite, silt, clays, ferroan minerals etc. All of these components ought to be included in the interpretation, but their number would exceed the number of well log measurements. In that case multiple rock models are defined; in each of them the number of equations is greater than the number of components.
• The creation of longer homogeneous intervals requires the comparison of model selection for neighbouring depth sites and change of models if another model with only slightly larger incoherence fits better into the environment, according to the principle of geological consistency. • If the lithologic rock composition provided by the selected model contradicts our knowledge from other sources of information (e.g. cores), a more plausible model can be accepted.
• New minerals (rock components) should be included; • Further rock models should be applied;
•
Zone
parameters should be modified.
Well log measurements Suppose L1, L2, ? Lm are well log measurements made in a borehole. A depth interval is selected where lithology should be evaluated: volumetric fractions of rock components (including porosity and solid minerals) should be determined. The interval is divided into zones (Z1, ?Zn) which are constructed of one or more sub-intervals. The Li log measurements are available at regular frequency - usually at each half foot.
Rock components and models The bulk rock volume is divided into effective porosity and solid rock components. The solid components may be minerals (calcite, quartz, kaolinite etc.) associations of minerals (ferroan minerals: oxides and hydroxides) or lithology types (limestone, sandstone, shale). Each rock component is characterized by its specific value of the applied rock measurements (zone parameters).
Response functions and zone parameters Response functions are mathematical relationships between the logging parameters and the rock mineral composition. These are theoretical functions which don't account for random errors or factors not involved in the model. Actual log measurements and theoretical responses generally differ.
System of equations The set of response functions creates a system of equations together with the material balance equation; the latter describes the fact that the sum of all volume fractions in a unit volume equals one:
nf
= nl + 1 - nv Incoherence Normalized incoherence is defined in Section 7. If the deviation of the measured logs and the theoretical responses is considered as a random error variable, the value of nf *.I2 has a chi-square distribution.
· At each depth site with each model, the set of volume fractions which minimizes incoherence is accepted as the solution. · At each depth site where multiple models are applied, the model with the least incoherence is selected (if other considerations don't override it).
·
Statistical characteristics of incoherence in a well or in a zone
are used as a general indicator of quality of interpretation.
Improvement by changing selection of minerals, values of zone
parameters, etc. is justified by the decrease of incoherence.
The mathematical problem that is to be solved for each model at each depth site is the following: · There is a system of equations consisting of nl + 1 equations and nv unknowns where nv < nl + 1 . The overdetermined nature of the system (more equations than unknowns) means that an exact mathematical solution generally is not found. · An object function (the normalized incoherence) is set up which describes the quality of each approximate solution of the system of equations. The goal is to find the set of volume fractions which minimizes the incoherence. · The restrictions on the valid range of volume fractions are taken into account. Penalty terms are added to the object function which assure that the final solution is inside the accepted range.
Strip logs of lithological composition are the usual way of graphical presentation of the interpretation. The volumetric fractions of the different rock components are displayed versus depth. At each depth site, the area covered by the specific colour code of the rock component is proportional to the volumetric fraction.
• The zone parameters of one (or more) minerals regarding that input log are not correct and should be modified; • Another rock component exists in the formation and it should be included in the rock models.
Rock components
involved in lithology interpretation are different in their degree
of certainty. Some of them are stable minerals (such as quartz,
calcite etc.) with well known attributes regarded as worldwide
constants. Other components are more complex mixtures of minerals
such as shale or ferroan minerals.
Another set of parameters which have great influence on lithology interpretation are the si standard errors associated with well logs included as input parameters. Both the magnitude of si-s relative to each other and their absolute value are important.
· Ratios of standard errors are based on the ratios of measurement errors (repeat sections can be used for the evaluation of this). · The influence of the well logs should reflect their quality and their ability to reveal lithology in the formation. (E.g. gamma ray may have greater influence in shaly sandstones than in carbonates.) · Both extremities (input logs with negligible influence or with overwhelming influence) should be avoided.
Constraints on the valid range of rock components are applied in lithology determination. The trivial conditions of 0 £ Vi £ 1 should be met, besides, upper limits on some accessory minerals Vi £ (Vi)max << 1 may be applied. The most frequent case of violation is that the volume fraction of a component tends to be negative; the mathematical algorithm sets this volume fraction equal to zero.
Matrix density is obtained from the formula:
F
: effective porosity provided by the quantitative lithological
It is important
to compare matrix density obtained from well log analysis with those
measured on cores, since it can reveal some errors of lithological
interpretation; for instance non-existing mineral or lithological
components were taken into account in the applied rock models, what
may cause serious difference between the two compared grain
densities.
|
|
||
|
Page Views ---- Since 01 Jan 2015
Copyright 2023 by Accessible Petrophysics Ltd. CPH Logo, "CPH", "CPH Gold Member", "CPH Platinum Member", "Crain's Rules", "Meta/Log", "Computer-Ready-Math", "Petro/Fusion Scripts" are Trademarks of the Author |
|||

|
||
| Site Navigation | MINERALOGY THEORY BEHIND PROBABILISTIC MODELS | Quick Links |