Petrophysical Training
Licenses
|
 SPREADSHEETS FOR
LOG ANALYSIS
SPREADSHEETS FOR
LOG ANALYSIS
Electronic
spreadsheets are now so ubiquitous that petrophysicists no
longer find them new or strange. This was not always the case
and it took some time for spreadsheets to gain widespread use in
scientific circles. Even today, their use for a complete
petrophysical analysis is rare. Most spreadsheets contain only
the math, leaving the usage rules to the memory of the user.
With a little extra effort at the beginning, the spreadsheet can
be made more intelligent to help guide the user through the
steps required.
A primary
objective of this Chapter is to demonstrate that you,
personally, can create your own intelligent expert system to
solve petrophysical analysis problems using electronic
spreadsheets with Excel or Lotus 1-2-3.
For a list of spreadsheet software available s for free
download, that may be useful to the practice of petrophysics,
click HERE.
 The main
part of this Chapter was originally presented at 12th Formation
Evaluation Symposium, Canadian Well Logging Society, September,
1989 as
"A Knowledge Based
Spreadsheet System To Reduce Complexity in Log Analysis". This
paper was written a long time ago and many of the limitations of
spreadsheet software and desktop computers mentioned in that
paper have disappeared. Most of the comments on the virtues of
spreadsheet software as compared to larger standalone log
analysis packages still apply. This Chapter brings the earlier
material into the 21st century. The main
part of this Chapter was originally presented at 12th Formation
Evaluation Symposium, Canadian Well Logging Society, September,
1989 as
"A Knowledge Based
Spreadsheet System To Reduce Complexity in Log Analysis". This
paper was written a long time ago and many of the limitations of
spreadsheet software and desktop computers mentioned in that
paper have disappeared. Most of the comments on the virtues of
spreadsheet software as compared to larger standalone log
analysis packages still apply. This Chapter brings the earlier
material into the 21st century.
An earlier paper describing the first use of
"Spreadsheet Analysis of
Logs" was presented at the 10th Formation
Evaluation Symposium, Canadian Well Logging Society,
September, 1985. This paper is truly obsolete, as none of
the software products mentioned is currently available, but
gives a good historical view of what was available in that
era.
The
current version of this spreadsheet, META/LOG PROFESSIONAL, runs
in Lotus 1-2-3 for Windows. Other versions run in Excel for
Windows. All versions are available for
Download
for a small membership fee. You can also read a software review "As Easy As..."
META/LOG Software Review by R. Y. Elphick. Geobyte, Fall 1989.
This software has been used for many projects, from single
wells on every continent to the entire Burgan oilfield in
Kuwait (770 wells, 1500 feet
per well). The math has been tuned on over 10,000 wells from
shaly sands to fractured carbonates, from tar sands to oil and
gas in granite reservoirs. View the
Project List for a short summary of
the more interesting jobs. Samples of the output can be found
throughout this website.
The system incorporates about 140 rules related to
appropriate log analysis methods, based on the rock type, fluid
type, and available log data. In addition, the rules choose the
best initial log analysis parameters for the methods selected,
derived from a knowledge base containing over 350 parameters and
a questionnaire which must be filled out by the user. A total of
30 different log analysis algorithms, offering 6700 uniquely
different analyses, demonstrates why an expert system is helpful
in reducing the complexity of modern log analysis.
In addition, core analysis, DST analysis, exploration
economics, and well history modules are integrated into the same
package, making it easy to calibrate results.
KNOWLEDGE BASED
SPREADSHEETS FOR LOG ANALYSIS
Most log analysis programs, including many spreadsheets,
are really pretty dumb. They expect the analyst to know which
method, parameters, and parameter values are best for any
situation. For the novice or casual log analyst, such knowledge
is too much to expect. This is where artificial intelligence, or
expert systems programs, play a role. They provide information
to the user, gleaned from experts in the field, which overcomes
the dumb-computer syndrome.
Successful well-log analysis is an acquired skill which is
very dependent upon the experience of the analyst. The knowledge
which an analyst brings to bear on a problem is very specific to
the region being analyzed, and therefore a considerable amount
of local information is required for successful analysis. Much
of this knowledge is available from published literature and
from archives of previous work.
This information is termed the knowledge base or fact base
of a log analysis expert system. Unfortunately casual users and
experts tend to forget this knowledge and are forced to look it
up or recreate it for each job. That's why it is useful to embed
the knowledge within the program, in the form of a data base
that can be updated as new knowledge is gained. Hard coded data
sets, found in most programs, are not very easy to update.
A further step involves extracting analysis rules and
methodology from an expert in log analysis. Rules are usually of
three types: usage rules which dictate which method is the best
choice for a given data set in a given area, parameter selection
rules, and "what if?" or iterative rules for trying alternative
methods or assumptions if results are not acceptable on the
first attempt. This information is termed the rule base of an
expert system.
An expert system enables a geologist or engineer to
perform complex well-log analyses which in the past, could only
be done with the assistance of a log analysis expert. In
addition, any interpretation, whether by an expert or not, would
require less work to provide more complete analysis results.
Further, it allows experts to share and consolidate their
knowledge and experience, for use by all analysts with access to
the system.
Systems of this type were described by the author in
fs. Although some of the systems are
commercially available, their cost, complexity, and immaturity
has restricted their use to date.
This Chapter presents an expert system for log analysis,
written in Lotus 1-2-3, which is inexpensive, simple, and well
tested. An equivalent package could easily be written in Excel,
but I am too lazy to attack the job.
While 1-2-3 may seem like an inappropriate shell for an
expert system, its ease of use and fourth generation features
provided many advantages not found in other low cost shells.
 An
electronic spreadsheet is a computerized replacement for the
pencil and columnar pad so familiar to log analysts who do hand
calculations at the well site or in the office. One virtue of
the electronic spreadsheet is that it can be much larger than a
sheet of paper, often allowing more than 256 columns of data
(with up to 72 characters per column) by many thousands rows
long. The screen or monitor of the computer is a window on this
large array of data. An
electronic spreadsheet is a computerized replacement for the
pencil and columnar pad so familiar to log analysts who do hand
calculations at the well site or in the office. One virtue of
the electronic spreadsheet is that it can be much larger than a
sheet of paper, often allowing more than 256 columns of data
(with up to 72 characters per column) by many thousands rows
long. The screen or monitor of the computer is a window on this
large array of data.
 META/KWICK, a simplified
petrophysical
analysis spreadsheet with no expert system or rule based
intelligence
META/KWICK, a simplified
petrophysical
analysis spreadsheet with no expert system or rule based
intelligence
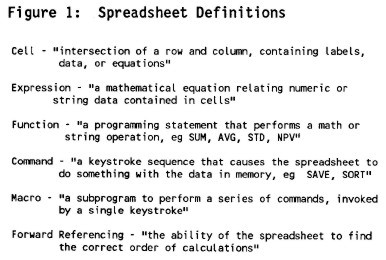
Each row is assigned a row number and each column is
headed by a column letter. The intersection of a row and column
is termed a cell. Cells are identified by their row and column
designation (e.g. C14). Movement around the portion of
spreadsheet seen on the screen is performed by moving a cursor
using the keyboard, lightpen, or mouse attached to the computer.
Cells can contain five kinds of data:
1. text or labels
2. numbers (raw data or answers)
3. formulae or algorithms
4. spreadsheet functions
5. comments
Because a cell can contain data, a formula to compute
results, or a reference to another cell which contains, the
result, a cell thus looks like a simplified frame in a
frame-based data structure. A cell containing text or a value
looks like an element in a data base, and can be used either as
an element
 or
a frame. A row or column, or an array of rows and columns, looks
like a record (a list of elements) in a data base and can be
manipulated in the same way. or
a frame. A row or column, or an array of rows and columns, looks
like a record (a list of elements) in a data base and can be
manipulated in the same way.
Mathematical formulae in spreadsheets show relationships
between cells (e.g. C1=+A1+B1). If the relationship in many
cells is similar (e.g. C1=+A1+B1, C2=+A2+B2, etc.) then each
individual relationship must be described. There are spreadsheet
commands which make it easy to copy a cell to other locations,
preserving the relationships between cells. Many other commands
allow the program designer to move or erase cells, insert and
delete rows and columns, format and justify data and text, and
many other housekeeping tasks.
A cell can contain very complex algorithms, which makes
them eminently suitable for log analysis. Up to 240 characters
can be used, and in rare cases, this limit has been reached.
Spreadsheet functions are shortcuts which help the user
perform common mathematical computations, such as SUM, AVERAGE,
MINIMUM, MAXIMUM, IF...THEN, and PRESENT VALUE. Some of these
are not even available in conventional programming languages but
must be coded uniquely each time they are needed.
The act of building a log analysis model with a
spreadsheet defines all the mathematical relationships in the
model, as well as the raw data and analysis parameters. A
trained user can edit formulae, insert rows or columns, fix
typographical errors, enter new data, and recompute results
without changing a Basic or Fortran program. The spreadsheet is
the program and the user is the programmer!
You can also play "what if?". You could vary the water
resistivity, matrix or fluid parameters, or shale values and see
the change in the log analysis results in a few seconds.
Computations can be revised immediately after entering a change,
or after entering all changes, as decided by the user.
The original spreadsheet, after testing and debugging, can
be used immediately, or saved as a standard analysis package.
Standard spreadsheets can be customized to fit individual
problems when they are used. Managers or professionals may
customize spreadsheets for their own use, or for use by other
professional or technical staff in other departments.
Results and data are saved on disc by saving the entire
spreadsheet or by extracting only desired portions (to conserve
space). Formatted printouts are provided by the WYSIWYG (What
You See Is What You Get) process. By using the spreadsheet macro
programming functions, a full report with attractive layouts is
a simple task for the user, although not so simple for the
programmer.
Standard crossplots and histograms are created by the
graph commands of the spreadsheet. Regression and sorting are
also useful commands.
What Is An Expert System?
Expert systems and artificial intelligence are not
new concepts. Researchers have worked to develop artificial
intelligence since the early 1950's for a number of reasons. One
is to help understand the human thinking process by modeling it
with computers. Another is to make better computer hardware by
modelling the computer more closely after the human brain. More
achievable goals, such as making computers act more human or
easier for humans to use, are also part of the AI spectrum, as
are robotics and pattern recognition or artificial vision.
Natural language understanding, automatic translation, and
automatic computer programming are other aspects of artificial
intelligence.
In the petroleum industry, well log analysis, property
evaluation, reservoir simulation, drilling operations, and
geologic interpretation have been attacked with AI techniques.
The distinctions between conventional programming,
intelligent programming, and artificial intelligence are not
hard and fast. Conventional programming uses procedural
languages such as Basic or Fortran to create sequential code to
solve explicitly stated problems. Intelligent programming goes
one step further. Here data bases are used to hold much of what
would otherwise be hard code. As a result, the system is much
more flexible, and program sequence or content can be modified
at will by the user, as can the knowledge contained in the
numeric and algorithmic sections of the data base.
Artificial intelligence software uses a process called
symbolic processing instead of linear processing of variables in
sequence. Although conventional computing uses symbols
(variables) in describing the program, the symbols are not
really manipulated by the operating system to create new
symbols, relationships, or meanings. In artificial intelligence,
new relationships between symbols may be found, if they exist,
that were not explicitly stated by the programmer. This is
usually called an undocumented feature or bug in conventional
software.
In addition, symbols without values can be propagated
through the relationships until such time as values become
available, again without help from the programmer. Anyone who
has had a divide by zero error while testing a program will
appreciate this feature.
One of the most economically attractive facets of AI is
expert systems development. Expert systems apply reasoning and
problem solving techniques to knowledge about a specific problem
domain in order to simulate the application of human expertise.
Expert systems depend on knowledge about the particular
specialty or domain in which they are designed to operate. The
knowledge is provided by a human expert during the design and
implementation stage, hence the name expert system. Such
programs most often operate as a intelligent assistant or
advisor to a human user. Modern usage invokes the phrase
knowledge based system to mean the same as expert system.
Thus, an expert system consists of:
1. A knowledge base of domain facts and heuristics (rules)
associated with the problem,
2. An inference procedure or control structure for
utilizing the knowledge base in the solution of the problem,
often called an inference engine,
3. A blackboard, or global data base, for keeping track of
the problem status, the input data for the particular problem,
and the relevant history of what has been done so far.
Components of an Expert System
The facts consist of a body of information that is widely
shared, publicly available, and generally agreed upon by
expertsd in a field. The heuristics are mostly private, little
discussed rules of good judgement that characterize expert level
decision making in the field. The rules may be difficult for the
expert to verbalize, and hence are difficult to elicit or share.
Some facts and/or heuristics may be proprietory to the user or
user's organization, and are thus not shareable outside the
organization.
As an example, the facts in an expert log analysis system
are the known properties of rocks and fluids. The heuristics
include mathematical rules such as Archie's water saturation
equation, as well as usage rules which describe when this
equation might be used in achieving the desired results.
Usage rules are based on the availability of log data and
constraints concerning hole condition, borehole and formation
fluid type, rock type, and tool or algorithm resolution. They
are intended to provide the best initial set of algorithms to
use.
The most popular approach to representing the domain
knowledge needed for an expert system is by production rules,
also referred to as SITUATION-ACTION rules or IF-THEN rules. A
typical rule for a log analysis system might be:
IF matrix density is greater than sandstone matrix density
AND lithology is described as shaly sand
THEN suspect a heavy mineral OR cementing agent
OR suspect inadequate shale corrections
OR suspect poor log calibrations
Most conventional log analysis programs contain checks and
balances of this type, coded in Basic or Fortran, with
appropriate action being dictated by user defined logic
switches. The virtue of an expert system knowledge base is
that the expert can modify this rule set more easily than a
hard coded program.
There are three different ways to use an expert system, in
contrast to the single mode (getting answers to problems)
characteristic of the more familiar type of computing. These
are:
1. Getting answers to problems -- user as client,
2. Improving or increasing the system's knowledge -- user
as tutor,
3. Harvesting the knowledge base for human use -- user as
pupil.
Users of an expert system in mode 2 are known as domain
specialists or experts. Those in mode 3 would be novices or
casual users. Anyone might use the system in the usual mode
1 context.
An expert usually has many judgemental or empirical rules,
for which there is incomplete support from the available
evidence. In such cases, one approach is to attach numerical
values (certainty factors) to each rule to indicate the
degree of certainty associated with that rule. In expert
system operation, these certainty values are combined with
each other and the certainty of the problem data, to arrive
at a certainty value for the final solution. Fuzzy set
theory, based on possibilities can also be utilized.
An expert system can act as the perfect memory, over time,
of the knowledge accumulated by many specialists of diverse
experience. Hence, it can and does ultimately attain a level
of consultant expertise exceeding that of any single one of
its "tutors". There are not yet many examples of expert
systems whose performance consistently surpasses that of an
expert. There are even fewer examples of expert systems that
use knowledge from a group of experts and integrate it
effectively. However, the promise is there.
 Designing an Expert System on a
Spreadsheet
Designing an Expert System on a
Spreadsheet
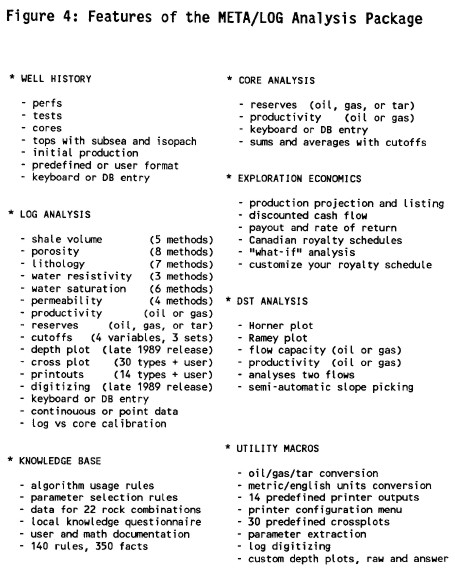
To demonstrate the use of expert systems concepts
in a spreadsheet, we will use a working log analysis program
called META/LOG. It contains the usual shale volume,
porosity, lithology, water saturation, permeability, and
productivity algorithms, and places for raw log data,
analysis parameters, and results. In addition, other useful
well data, such as DST analysis, well history, core
analysis, and exploration economics are included. The
functions of the system are summarized in the illustration
at the right.
META/LOG Features List  . .
Developing the three essential ingredients of an expert
system, the knowledge base, inference engine, and global data
base, on a spreadsheet is really quite easy. A key component is
a questionnaire which is filled out by the user. The
questionnaire is a knowledge acquisition vehicle, designed to
elicit facts known by the user that are not implicit in the log
data, such as the local geologic setting and personal analysis
preferences. This provides the system with necessary data about
log availability and quality, rock type and texture, fluid type
and viscosity, shale properties, and water resistivity data. The
questionnaire used in META/LOG is shown below.
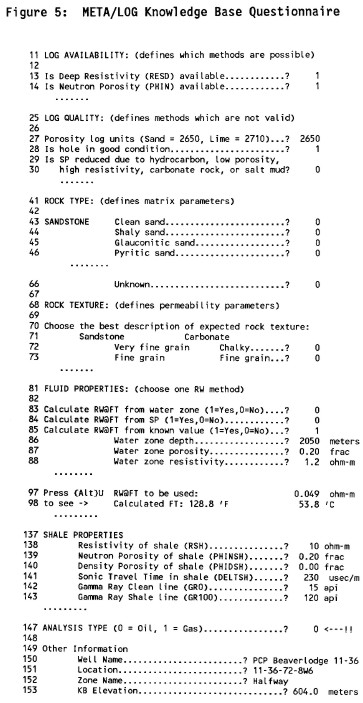 The
questionnaire is interactive; for example after entering
water zone resistivity, porosity, depth, and temperature
relationships, the actual formation water resistivity and
temperature that will be used are displayed. If these values
appear unreasonable, alternate sources can be derived within
the questionnaire. The
questionnaire is interactive; for example after entering
water zone resistivity, porosity, depth, and temperature
relationships, the actual formation water resistivity and
temperature that will be used are displayed. If these values
appear unreasonable, alternate sources can be derived within
the questionnaire.
The META/LOG Questionnaire
The main function of the questionnaire is to provide
sufficient information to the expert system, using an English
language interface, so that it can make choices that would
otherwise be left for the user to make. After all, who remembers
the Tpo value for water, the UMA for dolomite, or the PHI*SW for
fine vuggy carbonate. Indeed, who even knows what the
abbreviations mean.
The frames (cells) containing local parameters, world
parameters, assertions, and mathematical algorithms constitute
the knowledge or fact base. Basic parameters for sonic, density,
neutron, and photo electric effect are stored for about 22 rock
mixtures commonly found in productive oil and gas regions.
Additional data for porosity, saturation, lithology,
permeability, productivity, and recoverable reserves, all of
which depend on the rock and fluid description, are also kept
here. The fact base is easily accessible and values can be
changed by an experienced analyst to reflect his personal belief
or local knowledge.
The algorithms for log analysis are also in open code and
can be edited by an experienced analyst. Thirty of the most
popular algorithms are coded. With a complete log data set, more
than 6700 unique log analyses are possible. The rule base is
designed to show which individual algorithms are solvable and
which is the "best" set. Usually the method that uses the most
data is considered "best" unless a personal preference
over-rides this choice. A log analysis expert would easily
choose the best method for a given problem, but a novice would
not. The pre-coded algorithms in META/LOG are:
|
SHALE |
POROSITY |
SATURATION |
PERMEABILITY |
LITHOLOGY |
|
GR |
SONIC |
ARCHIE |
WYLIE |
NONE |
|
CLAVIER |
DENSITY |
SIMENDOUX |
TIMUR |
DENS/2MINERAL |
|
SP |
NEUTRON |
DUALWATER |
COATES |
PE/2MINERAL |
|
XPLOT |
SH SAND |
PHIxSW |
POROSITY |
S-D/2MINERAL |
|
RESD |
DUALWATER |
EPT |
|
N-D/2MINERAL |
|
MINIMUM |
COMPLEX |
TDT |
|
M-N/3MINERAL |
|
|
PE/DENS |
|
|
PE-D/3MINERAL |
|
|
PHIMAX |
|
|
|
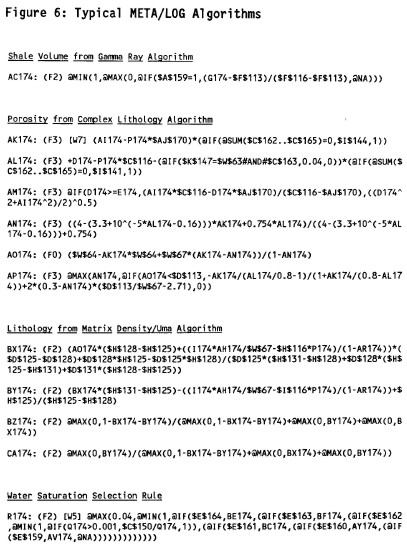 The
actual code for some of these methods is shown at the left,
to illustrate both simple and complex algorithms. In
addition, the frame-like nature of the cell contents is
clearly evident. Display and formating information is
embedded in the frame as well as its name (the cell
location). The distinction between rules and algorithms is
blurry, as demonstrated by the last algorithm shown; in
reality it is a rule to choose the "best" porosity
algorithm. The
actual code for some of these methods is shown at the left,
to illustrate both simple and complex algorithms. In
addition, the frame-like nature of the cell contents is
clearly evident. Display and formating information is
embedded in the frame as well as its name (the cell
location). The distinction between rules and algorithms is
blurry, as demonstrated by the last algorithm shown; in
reality it is a rule to choose the "best" porosity
algorithm.
Example
of simple and complex algorithms in celsl.
The rule base, coded
as IF...THEN statements, is kept in another group of records
(cells). The rules determine the feasible log analysis method,
based on the available data, borehole conditions, and the
expected rock and fluid type. Additional rules determine the
appropriate parameters for the selected method and expected rock
and fluid type. Some typical rules from META/LOG are shown
below. Note that the frame contains two parts - the actual
operating code for the rule and English explanation of what the
rule does. Note that the macro languages of today are far more
readable and self-explanatory than those of 1989.
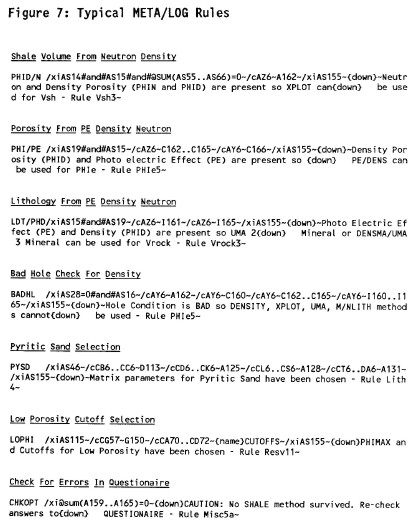
Typical META/LOG Rules
The algorithms and
rules operate on data stored in three areas - the knowledge base
containing relatively static facts, the raw data which contains
information particular to the current example, and the current
parameter/ options array. This latter data array serves as the
blackboard, or global data base, of the system. As rules are
fired, they check the current status of the blackboard and
update it in accordance with the instructions within the rule.
An extract from the blackboard is shown below.
The distinction between facts or parameters and rules is
also blurry. Facts are merely "terminal rules", that is, rules
that do not lead to further rules. A distinction is made here
because the appearance of a fact in the frame is so much more
concise than a normal rule. For example, the rule "If Lithology
is Glauconitic Sandstone, THEN matrix density is 2740 kg/m3"
takes a lot more effort and space than the same value placed in
an indexed array or lookup table. Both, however, accomplish the
same function within this program and facts may be coded in
either form.
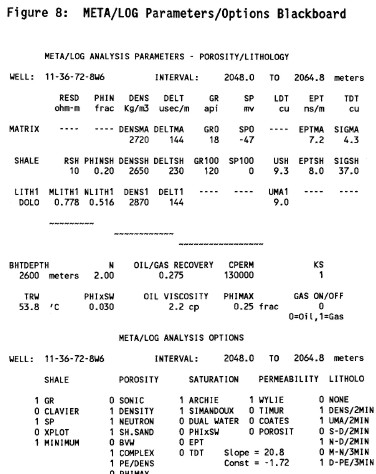
The
MTA/LOG Blackboard (Parameter Array)
The instructions in the
rule base are executed by a 1-2-3 macro, which operates as the
inference engine. When rules are written appropriately to review
all the related elements on the blackboard, they are order
independent. Some order is imposed voluntarily for simplicity,
eliminating the need for the inference engine to search both
ways in the rule base, although the Lotus macro language could
handle this situation if needed. For example, rules about log
availability and quality are executed before rock and fluid
rules. There is no point in executing rules which relate to
methods for which there is no data.
Rules can be moved or copied with the Lotus/Move or/Copy
commands, even though data in the fact base cannot unless you
are willing to re-write the affected rules. This is caused by
the fact that Lotus does not update cell addresses in macros - a
serious flaw in the use of a spreadsheet for a rule based
system. Moving rules allows you to insert a new rule that is
order sensitive. If you do add or change rules, you may also
need to change or add to the Questionnaire.
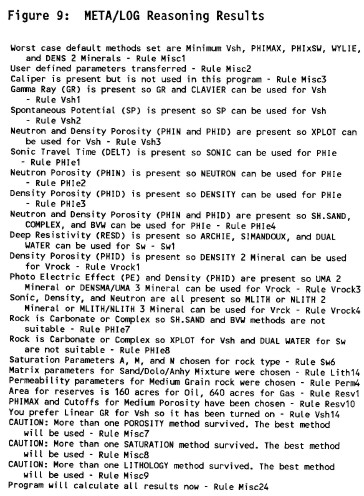
An audit trail of the reasoning used by each rule that has
been invoked by the inference engine is displayed on the screen
as each rule is fired. Review of this list allows the user to
verify that answers to the questionnaire were correct, and that
the methods and parameters chosen by the expert system are
reasonable. Only the rules that were fired are explained in the
reasoning. An example is shown below. No further interogation of
the reasoning is possible in the current program. However, by
changing answers to the questionnaire, differences in the
reasoning become apparent and act as an excellent training
mechanism.
 Finally,
a manual over-ride mode to fine tune the parameters and
methods suggested by the system, or to bypass the system
altogether, is available. By manually editing parameters and
option switches, the user can impose his own beliefs
independently of the expert system. This step is normal,
since log analysis is often an iterative process. Rules for
iterative enhancement of results are planned for a future
release. Finally,
a manual over-ride mode to fine tune the parameters and
methods suggested by the system, or to bypass the system
altogether, is available. By manually editing parameters and
option switches, the user can impose his own beliefs
independently of the expert system. This step is normal,
since log analysis is often an iterative process. Rules for
iterative enhancement of results are planned for a future
release.
Audit
trail of the expert system's reasoning
The advantages of a spreadsheet can be
stated simply - speed, low cost, ease of use, familiarity, and
limited programming skills required. The advantages of an expert
system are the ease of use by novices, consistency between jobs
and faster results with less chance for errors in the
parameters.
All the features of a simple expert system can be created
and tested by a log analysis specialist, and used in a
production environment by relatively inexperienced log alaysts.
No special training for the user is required. In fact, the
questionnaire format is a very natural interface between the
user and the expert system and could be invoked in any program.
A typical data set of ten depth points and five data
curves can be entered into an existing log analysis spreadsheet
in about two minutes by even a poor typist. The user must, of
course, know how to pick values off a log. The questionnaire
takes another two minutes to complete. The calculations take
about one tenth to two minutes, depending the CPU clock rate and
operating environment. Three or four crossplots can be viewed
and results can be printed in less than two minutes. Total
elapsed time is less than ten minutes. Each recomputation with a
different parameter takes less than a minute. Large data arrays
- say fifty depth points - can be entered, computed, and printed
in about 20 minutes using digital data from a data base or
standalone digitizer program.
It is important to calibrate log to core data results and
this is very easily accomplished. By adjusting shale, porosity,
saturation, and permeability parameters and recomputing, a
reasonable match, or a reason for the mismatch can be found.
Cores often do not cover the whole pay interval, so, after the
calibration step, one must be sure to revise the depths on the
hydrocarbon summary to cover all the pay. If many parameters
need adjustment, the elapsed time varies from 20 minutes to 2
hours depending on the severity of the problem.
Progressive engineers and geologists, familiar with
microcomputers and spreadsheets, can learn to use such a package
in less than an hour of practice. Modifying a spreadsheet or
creating new ones for specialized analysis should take only one
day's practice, and thereafter a few minutes to an hour may be
needed to tune the spreadsheet algorithms, rules, or facts to a
particular new problem. People with limited knowledge may need
as much as five days log analysis traianing plus three days of
computer and spreadsheet training before embarking on real work
with the system.
Because the screen layout, printed results, and data
structure are one and the same, the spreadsheet contents become
familiar quickly. The data sheet is always available for
viewing, compared to conventional log analysis packages in which
the data structure is invisible to the user.
Other factors, such as built in data management, file
storing and retrieving, graphics, simple and friendly keystroke
sequences, make spreadsheets more attractive than writing or
using Basic or Fortran programs. It is certainly easier to use
than most PC based expert system shells, which are usually not
designed for mathematically complex problems like log analysis.
Clearly, a spreadsheet is not an AI shell in the usual
sense. However, both forward and backward chaining are
possible, as they are in most programming languages. Data
representation is limited to whatever a cell can hold but
this is incredibly flexible. Frame based concepts are easily
supported, but others are less easy to formulate. This
rigidity in format and concept would not appeal to all AI
practitioners.
Spreadsheets are very memory hungry and like a lot of disc
space. There are workarounds for this, which must be used
whenever many large spreadsheets are needed. True symbolic
processing and uncertainty handling are not supported and
would be difficult to program in the Lotus macro language.
As a test bed for rules that reduce the complexity of log
analysis, the spreadsheet is a great prototyping tool. This
makes it easier to test concepts in a very inexpensive
vehicle and transfer successful concepts to more elaborate
models. If an appropriate shell can be found, that includes
all the data management and manipulation features of the
spreadsheet, it may be a better choice. However, most shells
are strong on data representation and weak on manipulating
data.
A number of commercially available digitizing programs are
available for use with META/LOG. These run in BASIC or
compiled BASIC, not in Lotus 1-2-3. They create an ASCII
file of each log curve, or a combined ASCII file of all
curves. Lotus 1-2-3 allows entry of this data in a three
step process.
First the ASCII file is loaded into an empty spreadsheet
using the Lotus 1-2-3 /File Import command. The ASCII file
must have a .PRN suffix on its file name for Lotus to
recognize it as a legal file. If the file name suffix is not
.PRN, the MS-DOS Rename command is used to change the file
name appropriately. Then the lines of data in the file are
separated into their columns using the /Data Parse command.
Columns of data may need to be interchanged to match the
column order of the META/LOG data array. Data can be edited
and depth shifted at this stage prior to combining into
META/LOG. Finally, this file is inserted into the META/LOG
spreadsheet by using the /File Combine command.
Log data on digital tape can be transformed to ASCII files
by a number of commercially available programs. Core data is
also available on floppy disc from some core service
companies. These companies provide utility programs to
convert their files to ASCII format. This file is then
loaded as described above for digitized log data.
All this seems like a lot of work, but in fact is not much
different than conventional log analysis systems. These
problems of data entry and display are not unique to
spreadsheet log analysis systems, but are more obvious
because they occur outside the spreadsheet environment
instead of being integrated into the system. The Lotus
spreadsheet also supports all the usual read and write
instructions to files or peripherals, so there is no reason
that normal plotter and digitizing programs cannot be
written within the macro language.
META/LOG EXAMPLES
The images below illustrate the printed results from a
typical analysis of a single well, using hand picked log
data. Sample plots using spreadsheet bar graphs and a low
cost commercial well log plotting package using continuous
digital data from an LAS file are shown below the printouts.
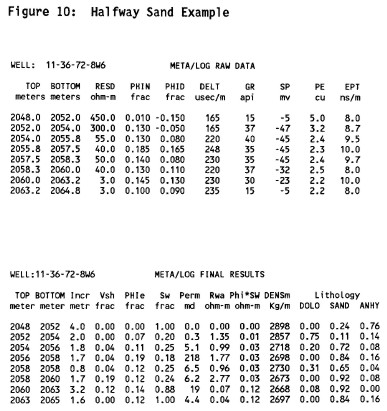
Hand picked raw data and petrophysical results from the
META/LOG spreadsheet
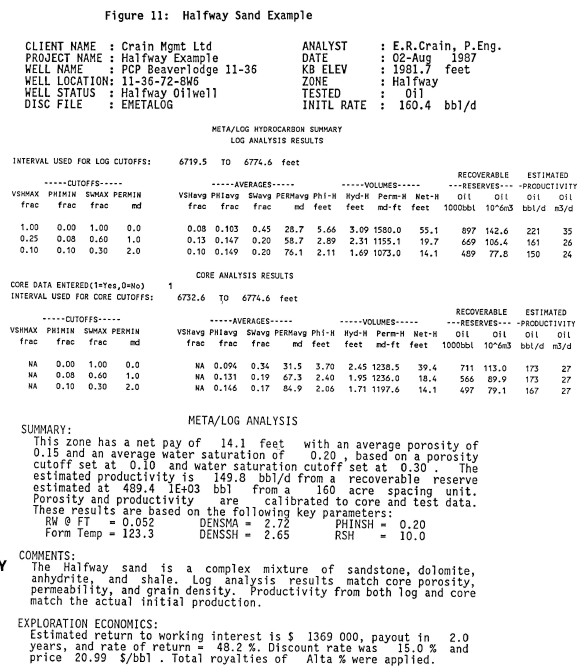
Net pay summary and English language report generated
automatically by META/LOG. Note that both log and core data
results are summarized.
On the summary page above, the log and core data match quite
well. Moreover, estimated initial productivity compares
favourably to the well's unstimulated initial
deliverability. Note that the text report is a useable final
product, ready for the well file or boardroom
completion/abandonment meeting without the errors and time
lag of a typist.
In the absence of core data, the expert system would have
underestimated permeability, and hence initial productivity,
by 50%. The analyst would have to recognize this problem by
using local knowledge and either manually recompute with a
different permeability parameter (CPERM) or change the
suggested values of CPERM in the knowledge base. It should
be noted that the productivity estimates embedded in
META/LOG are not suitable for fractured, stimulated or dual
porosity reservoirs.
Some typical crossplots, using Lotus graphics, are
displayed below. Plots are graphic dumps of the screen
contents to the printer, using Lotus PrintGraph and an HP
LaserJet printer. colour printer.
A large variety of core and log data crossplos can be
generated with spreadsheet software.
Cash flow, based on a current price and costs estimate, is
shown below. There is no doubt that this well is
economically viable and that more similar wells should be
drilled if possible. One advantage of tying economics to the
log analysis is that it gives a much better answer to the
question "Is the well any good?" than does porosity,
saturation, or net pay.
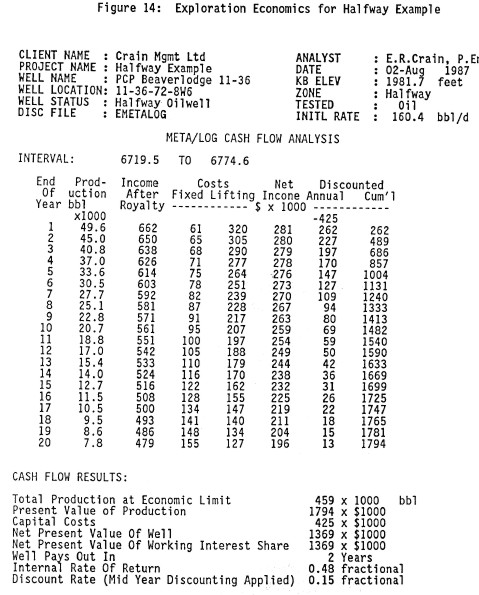
A cash flow projection based on the flow capacity results of
the well is easy to generate in a spreadsheet.
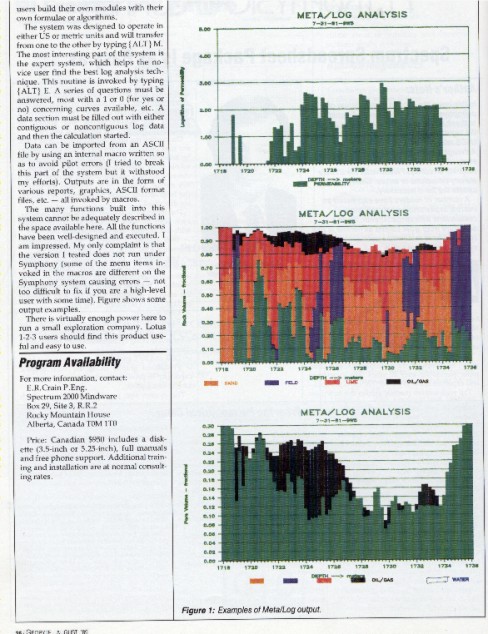
A second example,
shown below, is a radioactive sand (Keg River/Granite
Wash). The analysis model used the Uma/DENSma
crossplot for lithology and calculated porosity from the
density log with the mineral mixture determining the matrix
density at each point. The depth plot is the best that can
be achieved with Lotus and is suitable for quicklook
applications. By telling the system that radioactive sands
were present, the gamma ray was not used for shale volume,
but was derived instead from density neutron separation.
Bar graph presentation of a log analysis over a
radioactive sand - top track shows permeability, middle
track shows lithology, porosity and hydrocarbon fill, lower
track shows porosity and hydrocarbon.
The depth plots shown above may be considered as pretty
crude by log analysis standards, and they were never
intended to replace conventional depth plots such as the one
shown below for the Halfway sand. This plot was created
from a standalone log analysis plotting program, LAS/PLOT,
which reads LAS files created by META/LOG spreadsheets.
Professional quality depth plot of a dolomitic sand using
LAS/PLOT. The analysis was done with META/LOG expert syayem
spreadsheet and exported from the spreadsheet as an LAS file
for use by the plot program.
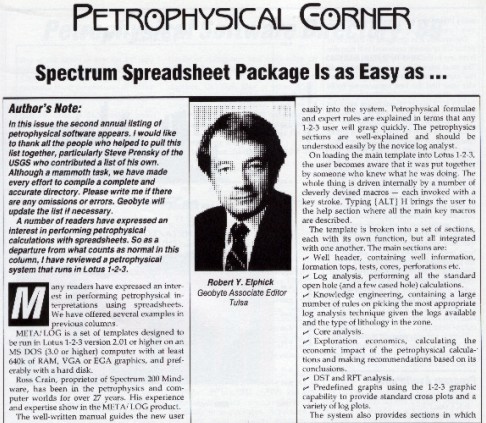
META/LOG software review in 1989 GeoByte Magazine
Spreadsheet analysis of logs with an
expert system to reduce complexity is a viable approach to
reducing the burden of quantitative log analysis. It provides
sophisticated analysis at low cost, is friendly and easy to use
and can be custom tailored to suit the needs of individual
analysts or problems.
|
|