|
 GAS
CORRECTIONS IN HEAVY MINERALS
GAS
CORRECTIONS IN HEAVY MINERALS
in many carbonate reservoirs, and some sandstones with lots
of heavy minerals, the heavy mineral effect
(separation) is offset by the gas effect (crossover) on the
density neutron log. The net result is that the gas goes
unnoticed because there is no crossover, and the lithology
is misinterpreted because the density neutron separation is
reduced. Observation of the PE curve will point out the
inconsistency. In the absence of the PE, sample descriptions
and core data will point out the problem.
IF gas is known to be present but NO
crossover occurs after shale corrections, this usually means gas
in dolomite or in a sandstone with lots of heavy minerals.
First, assume or calculate the matrix density(DENSMAgc) based
on the PE curve (PE is the only curve unaffected by gas):
1:
V1 = (PE - Vsh * PESH - PE2) / (PE1 - PE2)
2: V2 = 1 - V1
3: DENSMAgc = V1 * DENS1 + V2 * DENS2
Where:
DENSMAgc = matrix density for gas correction (kg/m3 or gm/cc)
DENS1 = matrix density of mineral 1 (kg/m3 or gm/cc)
DENS2 = matrix density of mineral 2 (kg/m3 or gm/cc)
PE = measured PE log value of rock mixture
PE1 = PE of first mineral (fractional)
PE2 = PE of second mineral (fractional)
V1 = volume of first mineral (fractional)
V2 = volume of second mineral (fractional)
Vsh = volume of shale (fractional)
DENSMAgc can be computed as a continuous curve or used as a zone
parameter to replace DENSMA in equation 8.
Apply gas correction:
4: PHIx = –
PHIdc / (PHInc / 0.8 – 1) / (1 + PHIdc / (0.8 – PHInc))
5: PHIxdn =
PHIx + KD3 * (0.30 – PHIx) * (DENSMAgc / KD1 – KD2)
Where: KD1 = 1.00 for English units
KD1 = 1000 for
Metric units
KD2 = 2.65 for
Sandstone scale log
KD2 = 2.71 for
Limestone scale log
KD3 = 1.80 for
Sandstone scale log
KD3 = 2.00 for
Limestone scale log
Density Neutron Complex Lithology Crossplot
- Gas zones with NO crossover. Enter shale corrected data and
then slide data point to the right until it reaches the line
representing the matrix density of the reservoir - travel
parallel to the nearest heavy black line. Do not use Dolomite scale log for this special
case.
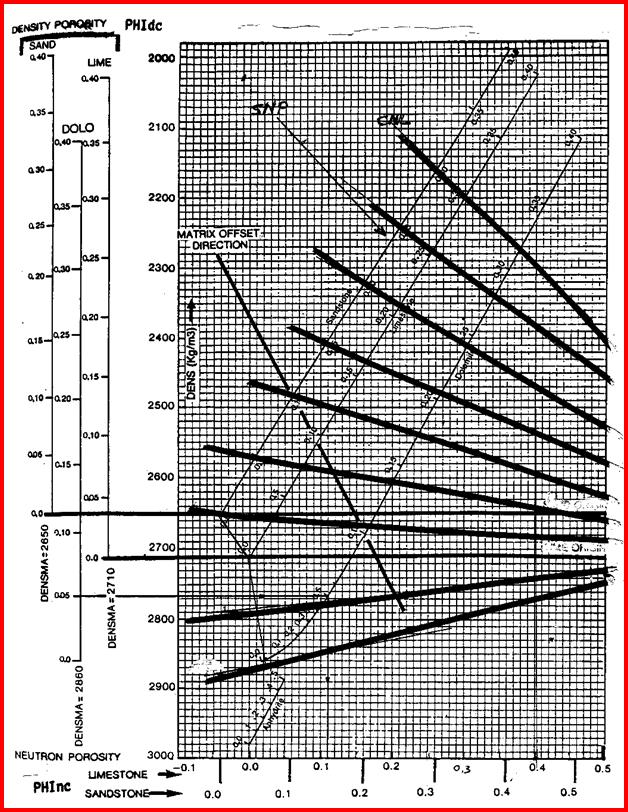
An illustration of how the points move under different conditions
is given below.
Graph for Gas Correction on Density Neutron Crossplot Porosity,
showing how the raw data points
move under various assumptions. (Porosity scales are in Limestone Units)
Point A goes to A1, if CNL and DENSMA = 2710 (crossover)
goes to A2, if SNP regardless of DENSMA
goes to A3, if CNL and DENSMA = 2870.
Point B goes to B1, if CNL and DENSMA = 2870 and gas correction
is IMPOSED
goes to B2, if CNL and DENSMA = 27l0 and gas correction is IMPOSED
goes to B3, if CNL and DENSMA = 2650 and gas correction is IMPOSED
stops at B if gas correction is not imposed or if SNP
Point C goes to C1, if CNL and DENSMA = 2870 and gas correction
is IMPOSED
goes to C2, if CNL and DENSMA = 2710 and gas correction is IMPOSED
stops at C if gas correction not imposed or if SNP
The author is indebted to Jim Hamilton of Dome Petroleum for first
suggesting this approach to one pass gas corrections. The approach
has proved extremely successful and has matched core on hundreds
of projects in many reservoir conditions.
Before the introduction of the photo-electric effect (PE) log
curve, it was easy for a log analyst to miss a gas filled dolomite
reservoir. The standard density neutron crossplot would show a
low porosity limestone, when in fact the zone is a medium porosity
dolomite. Since the density neutron looks like limestone (curve
separation is small) and the PE looks like dolomite (PE near 3.0),
this discrepancy is a red flag that a special case exists. Many
computer programs will not trigger gas corrections unless density
neutron crossover is present, and most programs do not contain
explicit algorithms to handle this special case.
The illustration below shows the effect of using this gas
correction. Notice that computed porosity does not match core
porosity unless the correct DENSMA is chosen. DENSMA should
reflect the matrix density of the expected lithology.
The correction is usually needed in dolomite or dolomitic sands
or high porosity shaly sands with low to moderate invasion.
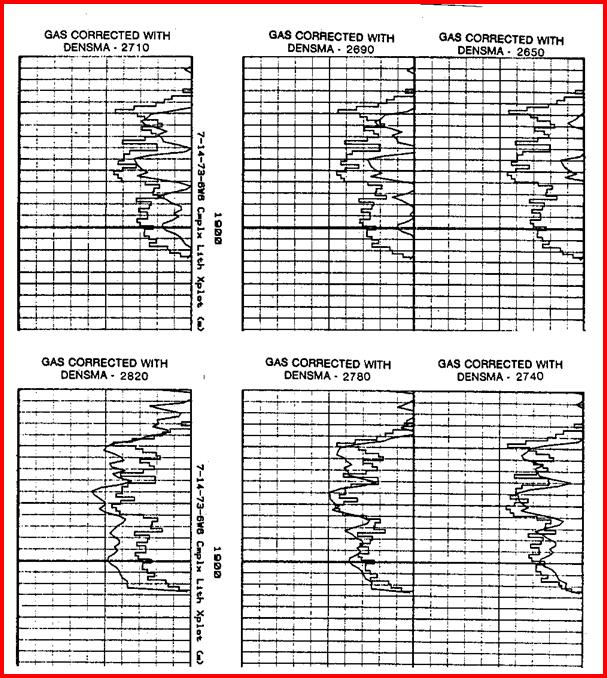
Effect of DENSMA on density neutron crossplot porosity
with gas in heavy minerals. Core porosity (square black lines)
and log analysis porosity (smooth black curves) show a good
match when DENSMA was set at
2710 - 2740 kg/m3. Log analysis shows near zero porosity if
DENSMA set at 2650 for this heavy sandstone.
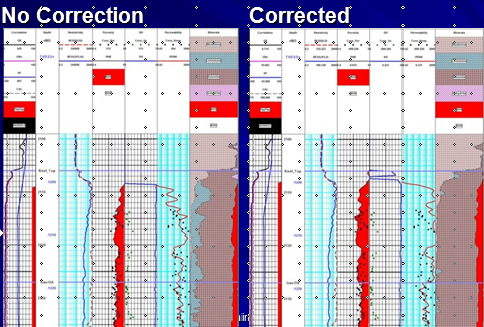
Gas in dolomite example with
no correction applied (left) and after correction (rig
|