|
 fracture LOCATION FROM SONIC LOGS
There is much literature concerning the effect of fractures on
acoustic wave propagation in porous and fractured rock. Unfortunately,
much of it is theoretical and not always supported by field examples;
often it is contradictory. Nevertheless, the sonic log is the
best fracture finder in older wells because other, more modern,
methods were unavailable at the time.
Today,
dipmeter and formation micro-scanner images provide more information,
but at higher cost, so sonic logs are still used extensively for
fracture identification. The modern full wave or array sonic and
dipole shear sonic tools provide much new information, including
shear wave travel time and amplitude plus full wave-train digitization
This allows the wave train to be further processed.
In
theory, the normal compressional interval transit time is little
affected by fractures so long as there is a free matrix path between
transmitter and receivers, as would be expected for vertical fractures.
In practice, large vertical and most sub-horizontal fractures,
create cycle skipping on the compressional transit time curve
on all sonic logs that rely on detection of the first energy arrival.
This is due to reduction in amplitude of the sound pulse by reflection
at the fracture face, and by destructive interference caused by
other propagation modes generated at the fracture. In addition,
refraction caused by near vertical fractures diverts energy from
the receivers, again reducing amplitude.
 Cycle
skipping makes the sonic travel time too long. Thus simple theory
is overwhelmed by the complexity of sound transmission in a heterogeneous
medium. Cycle
skipping makes the sonic travel time too long. Thus simple theory
is overwhelmed by the complexity of sound transmission in a heterogeneous
medium.
 Sonic log cycle skips may indicate fractures
On
the array and dipole shear sonic logs, travel time is usually found by
waveform correlation and not by first arrival detection
(although both methods are available). Therefore,
it is less likely to skip a cycle due to low amplitude. Amplitude
curves are presented as a matter of routine, so fractures can
be identified by low compressional and shear amplitudes. Sonic
curves on the array or dipole sonic can disappear or be shown
as straight lines where amplitude is too low to obtain a waveform
correlation.
Cycle
skipping is an excellent fracture indication in hard formations.
Shallow resistivity crossover might help confirm fractures
in a typical well with only an induction and sonic log.
Gas
in the formation or in the mud, poor borehole conditions, and
poor tool condition or recording parameters, especially on older
logs, may also cause skipping. Tool centralization is also important;
compressional amplitude can be reduced to less than 20% of normal
with the tool only 1 inch off center. This can cause skipping. Note that most modern sonic logs are
designed to avoid cycle-skipping so this identification technique
may not be useful in many newer wells.
Compressional and shear sonic amplitude versus
fracture orientation and tool centering
The
cause of the skipping can be checked; if the skips occur only
in a competent zone and not in the surrounding shales, gas in
the formation or fractures are the only possibilities. Cycle skipping
is more common on long spaced than on short spaced sonic logs
in hard formations, because of lower sound amplitude on longer
tools. The reverse is often true in softer sands and shales, due
to rock alteration near the wellbore.
In
contrast, shear energy is, theoretically, strongly reduced by
both horizontal and vertical fractures, but not much by fractures
between 35 and 75 degrees. In practice,
fluids and fluid filled fractures do not conduct shear waves,
and shear arrivals are strongly attenuated in fractured zones. On full wave or array sonic presentations,
the absence of shear arrivals or straight line segments on shear
travel time logs are sure signs of fractures. The Stoneley wave
amplitude is also strongly reduced by fractures.
To
differentiate between fractures and other causes of skipping,
a number of different logging tool designs and presentations of
sonic data have been developed. Special presentations include
the sonic amplitude, sonic wavetrain, and variable intensity (variable
density) displays, discussed below.
The
sidewall acoustic instrument was introduced to improve the bed
resolution and measurement of acoustic properties, but it was
not widely available or used. It is an acoustic pad device containing
one transmitter and two receivers designed to reduce attenuation
in the borehole and through the rock. The distance from the transmitter
to the first receiver is 9 inches, and the spacing between the
receivers is 6 inches. These dimensions allow for better bed definition
for porosity measurements and improved wave forms for fracture
studies.
Fractures
are more readily identifiable from this short spaced measurement
than from devices which measure and average a longer distance.
However, the measurement is affected by borehole rugosity and
only surveys a small portion of the borehole circumference. It
is best suited for thin bedded formations.
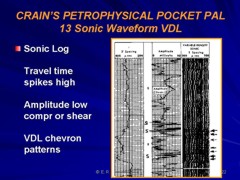
Sonic Waveform Logs
The
elastic constants of rocks determine the velocity of sound waves. Compressional
waves travel faster than shear waves and theoretically can be
seen separately on a display of sonic waveforms. Waveforms are
a record of sonic energy level versus arrival time. In practice
the two waves, and others, interfere with each other to some extent.
The
amplitude of both waves are affected by the rock type, porosity,
borehole rugosity, tool centralization, formation fluid, and fracture
size and orientation. The fractures may be only those induced
near the borehole wall by drilling or may be in-situ. Closed fractures
reduce the amplitude less than open fractures. Refracted waves
traveling other than direct ray paths can also reduce amplitude
and give false impressions of fracturing.
 The
usual way to record these amplitude values is to present the amplitude
of the first energy arrival, which is from the compressional wave,
in the form of a log curve, or to present the entire wavetrain,
or both. On the newer array and dipole shear sonic, the shear
amplitude is also displayed. On older logs, some attempts were
made to measure shear travel time and amplitude by adjusting gate
times and trigger levels on the instrument panel. These logs were
not too reliable, so take care if trying to use them. The
usual way to record these amplitude values is to present the amplitude
of the first energy arrival, which is from the compressional wave,
in the form of a log curve, or to present the entire wavetrain,
or both. On the newer array and dipole shear sonic, the shear
amplitude is also displayed. On older logs, some attempts were
made to measure shear travel time and amplitude by adjusting gate
times and trigger levels on the instrument panel. These logs were
not too reliable, so take care if trying to use them.
Sonic amplitude log may indicate fractures
Numerous
versions of these logs have been developed over the years, with
little standardization. Names such as Micro-seismogram, Fracture
Finder, 3-D Velocity, Acoustic Parameter, Shear Sonic, Variable
Density, and Frac Log were used by various suppliers. We will
use the generic term sonic amplitude log to cover all of these.
The
sonic amplitude log is a curve representing the first arrival
energy, measured in milli-volts. Energy varies with many factors,
so absolute values mean little, but low amplitude often means
fractures. All the things that cause cycle skipping, described
above, cause low amplitude, so fractures are only one possibility.
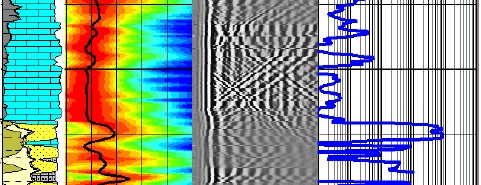
This log is usually combined
with a gamma ray, caliper, and a wavetrain presentation, as shown.
The
sonic wavetrain log is a display of the recorded energy presented
as wiggly trace signatures, usually one for every 6 inches to
2 feet of borehole. The variable intensity display, sometimes
called a variable density log, displays the same waveform information,
but the amplitude of the positive peaks are shaded gray or black
and negative peaks are white. When plotted continuously, dark
and light bands representing peaks and valleys are displayed versus
depth. Conventions have varied, and arrival time has been plotted
increasing right to left or left to right, with the latter used
today.
Sonic waveform presentation
Two
waveform logs, with associated gamma ray logs are shown above. Compressional amplitudes are lower than shear in most cases,
but two areas on the left hand log show reduced amplitude on both
compressional and shear waves, indicating fractures. Notice that
waveform arrival time increases from left to right.
Reflections
from fractures cause changes in amplitude and travel time of the
main signal, and some waves arrive at later times, out of phase,
thus causing irregular interference patterns on the waveform.
Usually chevron patterns spanning several feet can be seen, indicating
reflections from near horizontal fractures. Chevrons are difficult
to see on older VDL presentations, but are much more obvious on
more modern logs, as seen on the example below. Chevron patterns are not necessary
as diagnostic tools. Low amplitude
is all that is needed. Other interfering effects, such as Stoneley
waves and rough borehole cause jittery patterns. Vertical fractures
create less disturbance.
Example of modern sonic log with Stoneley wave travel timea (left)
and VDL display with clear chevron patterns in limestone, indicating
fractures, and none in sandstone interval. Permeability (right) is
from Stoneley travel time.
Normal
presentation of older sonic amplitude log includes:
1.
3 ft. spacing borehole compensated compressional travel
time
2. 3 ft. spacing compressional amplitude curve
3. 5 ft. spacing variable density display of entire
wave train amplitude
4. 3 ft. spacing single receiver compressional travel
time
On
modern logs, the shear travel time and shear amplitude are recorded,
along with complete waveform displays and other diagnostic curves.
Stoneley wave travel time and attenuation are also shown. Colour
images of the waveform correlation amplitude or colour versions
of the waveform display are now common (see Chapter Three for
tool details).
Fractures
are indicated when:
1.
amplitude of compressional first arrivals is low
2. single receiver travel time skips or does not track
compressional travel time
3. high frequency chevron patterns are seen on variable
intensity display
4. amplitude of shear wave arrivals is low
Note
that single receiver travel time may vary, often indicating poor
tool centralization.
Circumferential sonic log for fracture detection
is a rare commodity
A
circumferential sonic log has also been developed but was not
widely available. Sound pulses travel around the borehole wall
and are attenuated most by vertical fractures, due to reflection
at the fracture surface. Few examples exist outside the well logging
literature. Both the sidewall and circumferential sonic rely on
waveform analysis for fracture identification. By alternating
between the two transmitters, four separate wavetrain or variable
intensity displays are created, one for each quadrant around the
hole.
Evaluation
of any acoustic measurement is still complicated because many
factors other than a fracture system can cause attenuation or
distortion of the wave. Washout zones should be identified before
a fracture interpretation is made because they give similar responses.
In some shales, the compressive amplitude is larger than the shear
amplitude, which again looks like a fractured zone. A gamma ray
or SP log should be used to identify such zones.
Dipole shear image log shows directional stress
- the Fast Direction is centered on
90 degrees (east - west) which
is also the maximum stress direction.
Dipole shear sonic logs offer many display options
 On
the full wave or array sonic log, we can measure travel time and
attenuation of the compressional, shear, and Stoneley wave energies,
instead of merely the compressional energy as on conventional
sonic logs. On
the full wave or array sonic log, we can measure travel time and
attenuation of the compressional, shear, and Stoneley wave energies,
instead of merely the compressional energy as on conventional
sonic logs.
Shear attenuation may locate fractures or vuggy porosity
These
attenuations result primarily from the large contrast in acoustic
impedance between the rock matrix and the fluid in the fractures
and in porosity. As compressional and shear waves traverse a fracture
their energies are significantly attenuated with the greatest
attenuation occurring to the shear wave. Remember that high attenuation is equivalent
to low amplitude. Attenuation is measured in decibels per foot
or per meter (db/ft or db/m).
Another
cause of energy reduction is poor acoustic coupling in zones with
vuggy porosity. This attenuation is due to acoustic wave scattering
as it is being transmitted through the vuggy porosity. Analysis
of acoustic energies must be supported by porosity information
to distinguish this situation. Acoustic energy is not severely
attenuated by normal intercrystalline porosity.
Waveform correlation map shows attenuation in
fractures
Suitable
processing of the digitally recorded waveforms can enhance the
visibility of fractures. One example is to plot the velocity cross
correlations to observe the compressional, shear, and Stoneley
energy on a time versus velocity crossplot. The peaks of the contoured
correlation amplitudes show where the sonic energy is located. Illustrated
above is a comparison of a fractured and un-fractured
zone, showing the loss of shear energy as fracture intensity increases.
Note also that the log curve disappears (see left hand track)
because no energy is being received at the tool. The gap in the
log can be drawn as a straight line. This loss of data is equivalent
to cycle skipping on older logs.
Another
method involves filtering the waveforms to enhance the chevron
patterns caused by mode conversion interference. This is similar
to F-K or velocity filtering on seismic data. The dipole array
sonic sharpens the chevron patterns naturally, due to the different
propagation path of the directional acoustic beam compared to
the omni-directional pattern of the monopole array sonic
Stoneley reflection coefficients, computed from
adjacent Stoneley velocities, also help to pinpoint fractures.
|