|
 fractured reservoir CASE HISTORY
This example is from the Bent Horn Field, Cameron Island, in
the Canadian Arctic Islands. The field was produced briefly
during summer months, and a few tanker loads of oil were
taken from the Arctic to Europe each year until the field was
depleted.
Most
of the porosity for this reservoir is within the heavy mineral
zone, at the top of the log interval. Mineralogy here is quite
complex, containing barite, fluorite, quartz, calcite, anhydrite,
and clay in a relatively un-cemented form. A drillstem test recovered
these minerals along with oil. No drilling samples of this material
came to surface.
In
addition to production from the heavy mineral zone, there appears
to be some potential reservoir in the very low porosity carbonate
below. This limestone is near the front of the Bent Horn overthrust
fault, which strikes roughly east-west and dips (now) to the south.
Porosity logs for Well A-02, Overthrust Example
Sonic amplitude and borehole geometry for Well
A-02, Overthrust Example
Dipmeter results and raw curves for Well A-02,
Overthrust Example
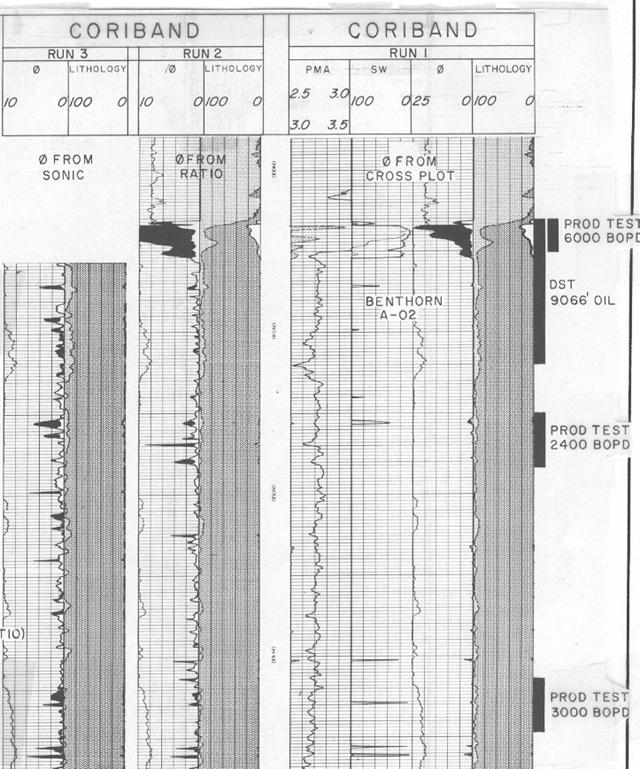
Computed lithology and porosity logs for Well
A-02, Overthrust Example
Displays
of all helpful logs (computed as well as original data) for well
A-02 are shown above. The initial indication
of fractures was from the caliper log (4-arm) reading oval hole
in certain zones, and from difficulty in keeping the sonic log
from skipping. The dipmeter correlation curves also show discrete
events on one or two curves that can be interpreted as high angle
(relative to the hole) fractures. Hole breakout on the caliper,
noisy density correction (not shown) and noisy density log all
point to fractures.
The
best dipmeter example is at 9198 (fracture dips north at 40 degrees)
and others at 9240, 9329 and 9355-9362. Some fracture planes are
so steep that dips were not computed by the dipmeter program due
to too low a search angle. The results using a higher search are
shown. In some cases, new (higher) dips are found and replace
lower, less coherent dips. In other zones no new data were found
and some were lost.
Other
zones of stress release fractures are indicated by the oval hole
indications on the borehole geometry log. The long axis of the
hole is perpendicular to the strike of the thrust sheet front,
and therefore parallel to the tension cracks caused by spreading
of the front. This orthogonal system of fractures would present
nearly vertical fractures at the borehole, and only those which
the dipmeter pads touched and which also depart locally from the
vertical will show up on the computed dipmeter.
The
sonic amplitude variable density log was run in open hole below
casing shoe at 10100, and in cased hole above this. Due to poor
cement bond, the VDL is not very helpful in locating fractured
zones through casing, but the portion in open hole (not shown)
indicates that the majority of the rock is fractured.
Sonic, borehole geometry and porosity logs
for Well O-51, Overthrust Example
Computed dipmeter and raw dipmeter for Well O-51, Overthrust Example
Computed porosity logs for Well O-51, Overthrust
Example
The
same logs for well O-51 are presented above. The amplitude VDL log is in open hole in this case. It
shows fracture zones at 7470-7506, 7636-7664 and 7920-8060. These
zones are confirmed by the dipmeter and the borehole geometry
log. Other smaller fractured zones are present on the log. The
distinctive "chevron" patterns on the VDL indicate semi
horizontal fractures, as opposed to the very regular "straight"
sections which indicate competent undisturbed rock.
The
limestone in this well dips to the east and the long axis of the
hole enlargement is roughly east-west, which is perpendicular
to the dip strike and parallel to the direction of hole deviation.
This is different from well A-02 where the hole
enlargement is perpendicular to strike, but also perpendicular
to the hole deviation direction. The "all quality" dipmeter
with the high search angle shows why some zones lose their coherent
dips when the higher search angle is used. The scatter of possible
dip answers is very large.
The
low porosity nature of the zone creates other interpretation problems.
The neutron porosity from the CNL (original log) is very low and
often a little behind zero. The sonic log (knowing we are in fairly
clean limestone) shows some porosity in the range of 0 - 4% on
both wells. This encouraged us to look
at computation methods that would utilize the more optimistic
porosity instead of the CNL (original) porosity.
Two
different approaches were taken. First, the Coriband program was
forced to use sonic log porosity (corrected for shale content)
by shifting density and neutron data above the highest sonic porosity.
Clay parameters were shifted the same amount, so that shale content
and matrix density are still computed correctly. Using the sonic
limit option then forces the program to use sonic porosity instead
of crossplot over the entire interval. These were dubbed "Sonic"
Coribands; results are shown in Figures 28.40 and 28.41.
The
second approach was to improve neutron porosity. This is done
by using the actual count rates recorded on tape and calculating
a porosity from each of the near and far count rates and from
their ratio. It is apparent from this data that the negative porosity
on the original log is generated by incorrect hole size corrections,
and completely distorts the true porosity picture. The log could
be shifted by about 1% to attain a more reasonable result, but
the logarithmic conversion from ratio to porosity is not handled
properly this way.
The
computed log which agreed most closely to the sonic porosity was
chosen, which in this case is the CNL porosity from count rate
ratios. Differences between sonic and neutron porosity are due
to secondary porosity, different response to vertical fractures,
and shale correction inaccuracies. No vuggy porosity was seen
in cores. Coriband was then run with the results shown. Saturation calculations can be improved by lowering
the formation factor exponent (M) to some value between 1.0 and
2.0, determined by the ratio of fracture porosity to matrix porosity.
This would have to be done on a zone by zone basis, and has not
been attempted in these wells.
The
A-02 well produced oil at rates up to 3,300 barrels per day through
perforations from each of several fractured low porosity zones
similar to the one at 9100-9130. It is possible that there was
communication behind casing to the main (heavy mineral) reservoir
at 9034-9054. There is also some reservoir volume in the fracture
porosity and in the low matrix porosity.
The
O-51 well tested a small amount of gas with water from comparable
rocks. It is structurally higher but obviously in a different
reservoir. The porous heavy mineral zone at the top is also missing.
|