|
 Seismic Velocity Analysis Techniques
Seismic ray paths, as shown
below, are rarely
straight lines, but rather follow the laws of refraction,
resulting in curved ray paths. The exact shape of the path
is determined by the rock velocity distribution versus depth
and the spread geometry. In the seismic record shown below, the apparent
curvature of the seismic reflections is caused by these
factors.
Sound velocity in the subsurface can be found directly from the
seismic data by observing the difference in arrival time of
reflectors versus distance from the source. The time difference
is called normal moveout or NMO.
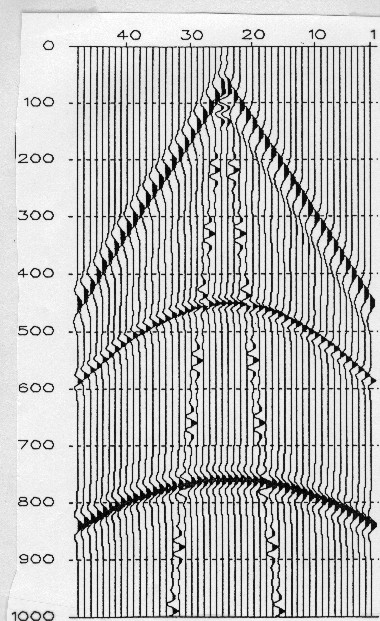
Raw 24 trace seismic record showing normal moveout
A
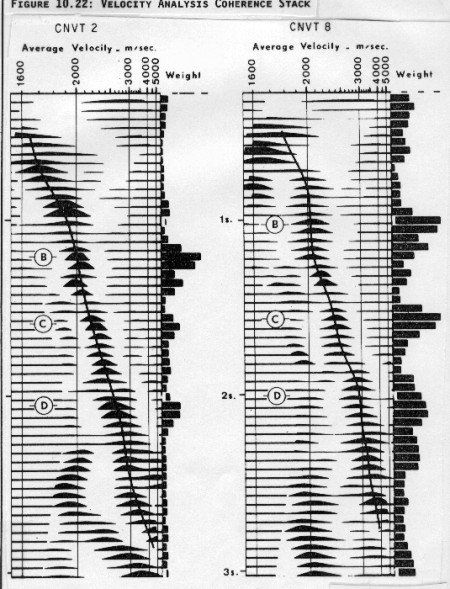
large number of semi-automatic techniques have been developed to
derive seismic velocity from seismic data independently of well
log data, The illustration below show two types of velocity
analysis display. Many others have been developed over the
years. The principle of such techniques is based on computerized
approximations to normal moveout analysis which used to be done
by hand calculation. The normal moveout is often called delta-T,
just as the sonic log interval transit time is called delta-T by
log analysts (abbreviated DTC in this Handbook), so we will always
use the term normal moveout (abbreviated NMO) to avoid
confusion. My first job as a geophysical engineer in 1967 was to
plot NMO versus depth, pick the slopes of the graph and enter
the data into a TIAC computer to calculate velocity.
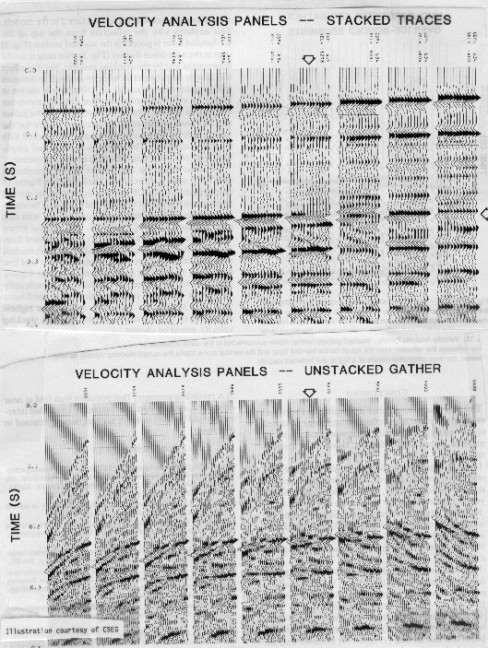
Velocity analysis display - velocity panels
Velocity analysis display - cross correlation
panels
|