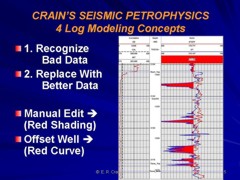
Shaping log curves at bed boundaries An obvious lag is seen in the density and neutron data at the top of the coal zone. The shaded areas indicate how the log should be shaped, so that the computer analysis program will not give false shows of hydrocarbon at the top of the zone. Sonic and resistivity logs demand similar edits. If necessary, trim the tops and bottoms of other bed boundaries, including interfaces between clean sand and shale, and limestone - dolomite - anhydrite - salt sequences. Depth adjustments should be made concurrently. Thin beds may also require curve shaping. Illustrated below are two thin beds on the shallow resistivity curve at the base of each clean sand. The deep resistivity curves show only a subtle hint of these beds and do not indicate their true value. Resistivity modeling software or a sharp red pencil will fix this.
The analyst can ignore the problem in this example, since the zones are thin and do not contribute or detract from the reservoir, but you may need to do significant work or run specialized thin-bed logs in other cases. A second approach is to apply thin bed corrections, available from service company charts. This work is usually done by hand as it is more difficult to write suitable computer programs. Such programs scan up and down one curve searching for thin beds and apply reasonable corrections to another curve. A
third and more pragmatic approach is to shape the deep resistivity
curve to match the shallow curve. Depending on the anticipated
hydrocarbon content, the curve amplitude can be amended higher,
lower or equal to the shallow curve. Do not try to extend this
concept to match the resolution of micro resistivity logs. Some
service companies can provide this service on some newer logs. |
|
||
|
Page Views ---- Since 01 Jan 2015
Copyright 2023 by Accessible Petrophysics Ltd. CPH Logo, "CPH", "CPH Gold Member", "CPH Platinum Member", "Crain's Rules", "Meta/Log", "Computer-Ready-Math", "Petro/Fusion Scripts" are Trademarks of the Author |
|||

|
||
| Site Navigation | LOG EDITING SHAPING BED BOUNDARIES | Quick Links |