Curves that are run on the same pass can also be off depth with each other. Some curves are memorized by the recording equipment because they are actually recorded a few feet above the lowest curve on the logging tool. The operator can set the memory distance incorrectly or the electronic memorizer can malfunction. Even computer controlled logging does not eliminate this problem. Should the logging tool pull tight in the hole, it may slow down or even stop, while the cable keeps moving and stretching. Since the cable movement drives the recording camera, curves will be recorded off depth during this period. As a result of the memorizer, each curve will be off depth at a different location on the log. After the tool pulls free it will move up the hole quickly while the logging cable driving the recorder will not. Therefore, the logs are again off depth, but in the opposite direction. This problem can only be adequately resolved if a curve exists which did not pull tight. Other curves can be stretched and squeezed to match the reference curve by computer programs or by approximate depth shift tables constructed by hand.
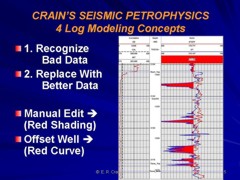
At times, a smooth log curve may not exist. Therefore, it is necessary to review an offset log or another curve from the same well. Note that, the edit gives a sonic porosity of 5% - 10% instead of 25%. It indicates a major difference and is more probable for this particular zone.
CAUTION: Some noise may be the result of thinly bedded porous layers, coal, or rough hole effects. Coal spikes should be identified as such, and bad hole effects discounted. Some bad hole is caused by breakout of the wellbore at natural fractures. The density log is the most strongly affected curve. The density log porosity should not be used as an indicator of reservoir volume, but the location of the fractures should be noted. If the sonic log is edited, the integrated transit time curve must also be corrected.
As a result two problems occur. Conductive mud causes the induction log to read too low due to invasion and borehole effect. This can be corrected by using special charts for invasion and borehole corrections. These charts are unique to particular tool types and can be obtained from service companies. Borehole correction charts are available from each service company and may be incorporated in computer aided log analysis programs. Since each tool from each company requires its own individual correction chart, the charts in the computer program may contain only a generic correction. The second problem is the hashy nature of the log in low porosity zones, caused by variations in borehole effect. An edit is required to select a reasonable resistivity value and is shown on the log. The offset log, as well as the gamma ray, sonic and density neutron curves are used to provide the proper amplitude and shape. This is obviously a very serious change of log values and all calculated results should be used with extreme caution.
All pad type devices, such as density, sidewall neutron, microlog, proximity, and dipmeter logs are ineffective in large holes, where the hole diameter is beyond the reach of the pad. Tools will either read the mud value or jump from high to low values due to intermittent contact with the borehole wall. Log data from these curves must not be used in this environment. In holes ranging from bit size to approximately 30% of the pad extension, the tool response is probably correct. From 30% to 90% extension, logs may appear reasonable, but are influenced by mud between the pad and borehole wall. A similar effect may arise in thick mud cake where the hole size is smaller than the bit size. Rough or rugose holes will also leave excessive mud between the pad and borehole wall. This effect may not seem too noticeable on most logs, since the caliper may appear smooth. On the density log, the correction curve will be abnormally high in such zones. This problem cannot be detected on most other logs. Therefore, caution is recommended. The MSFL does have an apparent mud cake thickness curve (Hmc) which will be abnormally high in such conditions.
We
know these logs are inaccurate because the apparent porosity is
too high compared to other sources of information such as the
sonic and offset wells. As well, the density neutron crossover
infers gas, yet this is not indicated by other logs or well data.
The porosity is abnormally high for a Devonian carbonate and the
density correction curve suggests caution. For reservoir evaluation,
the density data should be ignored. For seismic uses, an approximate
density would be estimated based on lithologic description and
offset well data. |
|
||||
|
Page Views ---- Since 01 Jan 2015
Copyright 2023 by Accessible Petrophysics Ltd. CPH Logo, "CPH", "CPH Gold Member", "CPH Platinum Member", "Crain's Rules", "Meta/Log", "Computer-Ready-Math", "Petro/Fusion Scripts" are Trademarks of the Author |
|||||

|
||
| Site Navigation | LOG EDITING CHECKING LOGGING PROBLEMS | Quick Links |