|
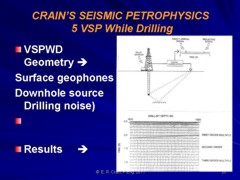
 Vertical Seismic Profiles While Drilling
A vertical seismic profile can be created by lowering a geophone
into the wellbore and using surface energy sources, as described
above. A measurement while drilling technique, commonly called
a TOMEX survey, uses the vibrations from the drill bit as a downhole
energy source, using surface geophones to record the signal. The
significant advantages include broader spatial coverage, easier
access to rugged terrain, and much more detailed recording versus
depth in the borehole. Multiple offset and radial 3-D surveys
are much cheaper with TOMEX than with wireline VSP.
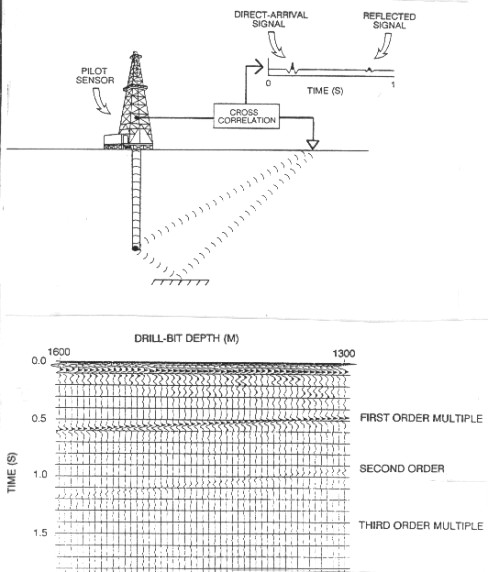
The
continuous signals from the drill bit are transformed into VSP
displays using cross correlation and de-convolution. The energy
source signature is obtained by continuously recording the vibrations
on the drill pipe. The time lag for the reference signal to travel
up the pipe is calculated from the length of the pipe and the
velocity of sound in steel. Cross correlation is used to define
the signature in the same way as for Vibroseis sources.
De-convolution
of the recorded geophone traces with this signature produces the
seismic traces. Traces are stacked continuously as drilling proceeds
and an output trace is generated every 10 feet of drilled depth.
By taking into account the geometry of the drill bit and geophone
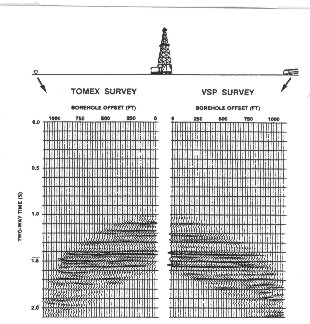
locations, the VSP section can be displayed. Data quality is comparable
to conventional VSP data, as shown in the comparative example
below. Rig noise can sometimes be a problem, but it
can usually be cured.
VSP while drilling
The
geometry of the system and the de-convolved traces versus depth
are shown below. Because
of the close spacing, a very accurate time - depth plot can be
created. This allows continuous calculation of
an interval velocity log, equivalent to a sonic log filtered over
a ten foot span.
VSP while drilling - geometry and recorded traces
after de-convolution
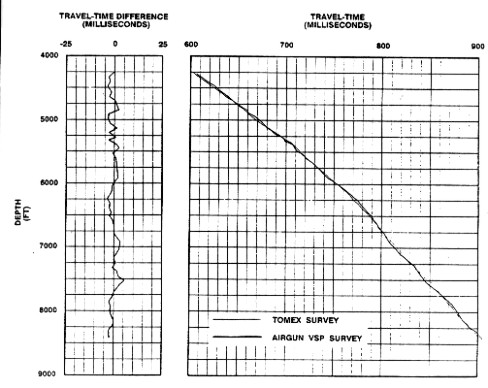
Time - depth plot from VSP while drilling
|