|
 Porosity - Lithology Case History
These
case histories represent just a few of the possibilities for
processing seismic inversion data to aobtain various
attributes that help to represent the seismic data in terms
of rock type, reservoir quality, and spmetimes fluid type.
Vp/Vs
Ratio and Poisson's Ratioo
Thedisplays
below demonstrate this technique.
A standard compressional seismic section is shown in the first
illustration. The color code represents compressional interval
velocity, determined from detailed velocity analysis. It can also
be found from seismic inversion as described earlier. The shear
wave seismic section is first stretched so that all reflections
are displayed at compressional arrival times, then it is color
coded to display shear interval velocity. The discreet interval
velocity data is transformed into Poisson's ratio by the above
equation and presented as a cross section, color coded in steps
of Poisson's ratio.
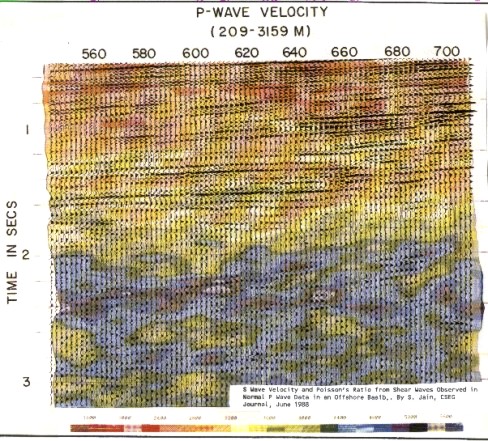
Compressional wave inverted velocity section
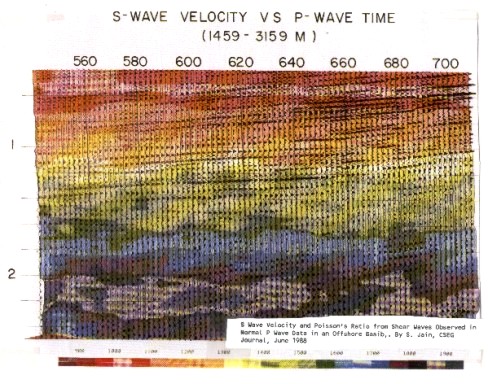
Shear wave inverted velocity section
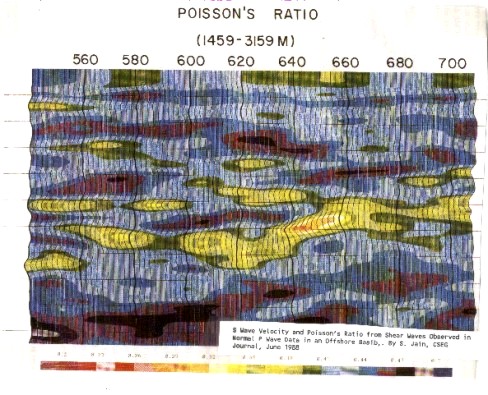
Poisson's ratio seismic section
The
light yellow color on the final plot probably indicates a gas
sand which is not directly visible on either the seismic
amplitude or velocity displays. Control of seismically derived
Poisson's ratio data by comparison to well logs is complicated
by the fact that the sonic and density log data is affected by
mud filtrate invasion into gas zones. Thus the logs must be
modeled for this effect before they can be used. This type of log modeling is called fluid replacement
and is best accomplished using the log response equation.
A
handy chart for determining lithology directly from Vc and Vs
is shown below.
Lithology from shear and compressional velocity
Qualitative Porosity
Indications
The
following illustration shows a porosity study based on inversion
and calibration of porosity to the inverted acoustic impedance
curves. Seismic shear data was not required for this work, but
it would be helpful in a similar study in carbonate reservoirs.
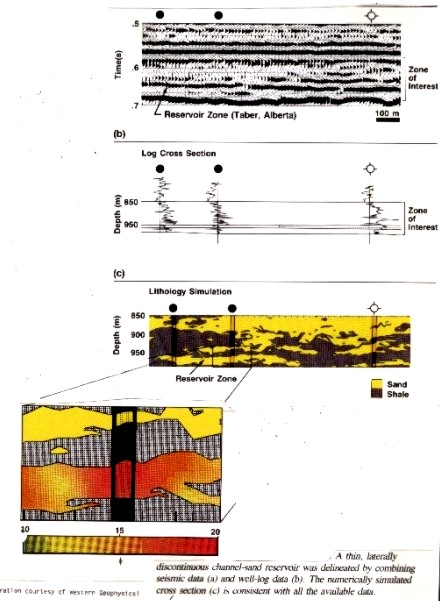
Sand - shale porosity analysis from inverted acoustic impedance
calibrated to well log data
Determining
which attribute or combination of attributes will correlate to
reservoir properties may require some trial and error testing.
There are more than 20 possible attributes and their permutations
and combinations can be quite large. The usual choices are Vp/Vs,
Poisson's ratio, instantaneous compressional amplitude, compressional/shear
amplitude ratio, and other related combinations. In all cases,
log modeling and quantitative log analysis will be required to
control the inversions and attribute calibration.
There
are many connecting links between the seismic and well logging
domains. Both develop velocity, density, and lithologic relationships
from their measured data. A synthetic view of seismic response
can be made from well logs, as can the inverse process create
a sonic log from seismic data. A clear understanding of the sources
and definitions of acoustic velocity information, and the ability
to communicate these differences, will go a long way toward integrating
exploration and evaluation techniques.
Analysis
and interpretation of this diverse suite of data leads to a petrophysical
description of the reservoir. In many cases, rock and fluid properties
can be inferred and mapped. When calibrated to "ground truth",
meaningful exploration and development decisions can be made with
less risk. However, if the calibration is not attempted or done
poorly, the results are mere arm-waving that may increase the
chance of failure.
Do
the work. Integrate the geo-science disciplines. Check your work.
You'll be a happy puppy after it's all over.
|