|
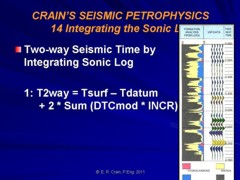
 Integrating the Sonic Log
The reflection coefficient set that is calculated from sonic and
density log data could be a string of numbers versus depth. This
is because logs are recorded versus depth. However, we need a
string of reflection coefficients versus two way seismic time in
order to make a synthetic seismogram. To translate depth to two
way time, we use a time versus depth plot made from an edited,
integrated sonic log, or a computer representation of such a
plot.
Integration is a summation of the sonic log readings taken at
equal depth increments. This is often adjusted to a datum depth
or time horizon, not necessarily the surface. Because the sonic
log depth is measured relative to the surface but cannot often
be recorded all the way to the surface, we also have to estimate
or tie the sonic integrated time to a known horizon below the
surface casing. The checkshot survey plays an important role in
tying the sonic to surface or some other datum.
The
formula is:
1: T2way = Tsurf -
Tdatum + 2 * Sum (DELTcor * INCR)
Where:
__Tsurf = Two way time from
surface to start of sonic log (ms)
__Tdatum = Two way time from
surface to desired datum (ms)
__DELTcor = Edited sonic log
reading adjusted to SRS or VSP (us/m or us/ft)
__INCR = Digitizing
increment (meters or feet)
Once
the integration is finished, a depth and acoustic impedance can
be calculated for each two way time, by interpolating linearly
between two digitized data samples. For more precision, a spline
interpolation can be used. The reflection coefficient string is
then calculated from the interpolated data. The sonic and
density data should always be edited before integration.
The
depth digitizing increment should be fine enough to allow
reasonable interpolation between the time sample points. The
time sample rate is chosen to include the highest frequency
(thinnest) events desired on the synthetic. Sample rates from
0.25 to 8 ms are used, with 1 ms the most common. Depth sample
rate to match the time sample rate depends on the rock velocity.
Too fine a depth sample rate wastes computer time and storage
space; too coarse gives poor results.
Some
sonic logs have integrated travel time indicated by tick marks
along one margin of the log. These are ONE WAY travel times.
Hole volume integration may also be indicated by tick marks, and
can be confused with sonic integration ticks. These ticks were
made before editing, so they are seldom used directly in making
a synthetic seismogram. Some integration ticks are recorded
incorrectly, and each case should be checked against the actual
log data to verify the validity of the integration.
A
computed log analysis on two-way time scale with VSP or
synthetic seismogram traces allows accurate horizon picks and
correlation of attributes to lithology or fluid content.
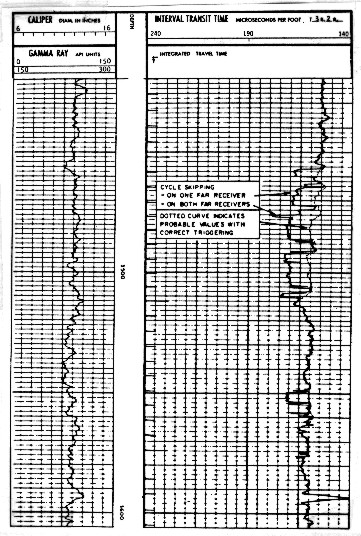  A sonic log with integration tick marks along the right edge of the
depth track
A sonic log with integration tick marks along the right edge of the
depth track
The integration
tick marks are very hard to see on many logs. This example has them
along the right edge of the depth track. Many tick marks fall on or
near depth lines. Every tenth tick is larger than the others to make
it easier to count. The ticks can appear on any margin of the log
and are generally easier to see on modern digital logs.
Remember to re-integrate after any edits.
|