|
 Step By Step Procedure
for Seismic Modeling
Step By Step Procedure
for Seismic Modeling
We will start with four basic definitions:
1.
forward seismic modeling - making a synthetic seismic trace from
EDITED sonic and density log data.
2.
inverse seismic modeling - making a synthetic acoustic impedance
log from a seismic trace.
3.
seismic interpretation - making correlations, picking horizons,
and mapping seismic data, with geological and well log data for
control.
4.
modeling a log - calculating what a log should read in a given
rock and fluid mixture, including the creation of synthetic sonic
and density logs from other logs or geological/seismic data.
Just
as log analysts use core data as ground truth to calibrate their
log analysis results, geophysicists use synthetic seismograms
created from edited log data as their ground truth.
Structural
interpretation of seismic sections involves identification of
reflective horizons and picking of seismic travel times for each
trace on each horizon. From these data, time, and subsequently
depth, maps are made for each horizon. Choosing the exact horizon
time is sometimes difficult, since the bed boundary may not be
on a peak or a valley of the seismic trace. A synthetic seismogram
is often used to calibrate these time picks.
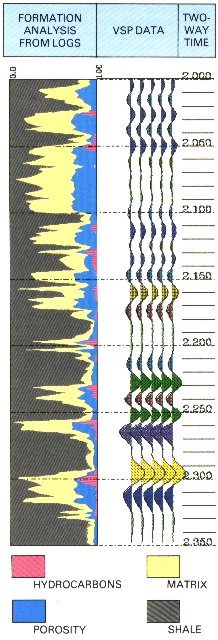 Stratigraphic
interpretation is based on the ability to correlate seismic character
to subsurface geology, instead of just seismic two-way times.
The correlation is established at a well with a synthetic seismogram
computed from edited well log data. The shape and amplitude of
the reflection on each trace is important in its interpretation. Stratigraphic
interpretation is based on the ability to correlate seismic character
to subsurface geology, instead of just seismic two-way times.
The correlation is established at a well with a synthetic seismogram
computed from edited well log data. The shape and amplitude of
the reflection on each trace is important in its interpretation.
The
steps in making a synthetic seismogram are:
1.
edit the sonic and density log for borehole and recording problems,
based on regional trends, offset logs, and mathematical models
of log response.
2.
model sonic and density logs in formations which have been affected
by invasion or rock alteration, based on a comprehensive quantitative
log analysis.
3.
model effects in carbonates caused by porosity type or density
contrast, based on log analysis and geologic data.
4.
integrate the modeled and edited sonic log.
5.
interpolate equal time increment values for sonic and density
(and other log) values from depth data.
6.
calculate acoustic impedance and reflection coefficients from
modeled and edited logs.
7.
generate an appropriate wavelet.
8.
convolve wavelet with reflection coefficients.
9.
plot synthetic seismogram on an appropriate time scale.
10.
check results against real seismic data.
11.
revise edits or log models over intervals that do not match real
seismic, OR improve seismic processing, OR change wavelet characteristics.
12.
make "What-if" models to test alternate interpretations
and sensitivity to fluid, porosity, and lithology assumptions,
as well as wavelet shape and frequency.
13.
remodel zones which do not tie as to time, amplitude, or character,
and check again If
possible, the wavelet to be used is based on frequency and phase
measured from the seismic data we are trying to match. A seismic
wavelet can be extracted from real seismic data by autocorrelation
of a seismic trace. If this is not done, a wavelet can be generated
from various mathematical expressions, or by filtering a unit
impulse with a band pass filter..
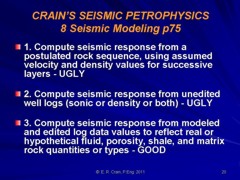
Synthetic
seismograms derived from unedited and un-modeled data are common
commercial products from all vendors. Two typical examples are
shown below. They are useful for gross correlation and
major reflector identification. Most vendors allow the purchaser
to customize the product to include the type of editing and modeling
described in the following Sections. However, the responsibility
for the model parameters rests with the client as few suppliers
have the log analysis skills to prepare adequate log models.
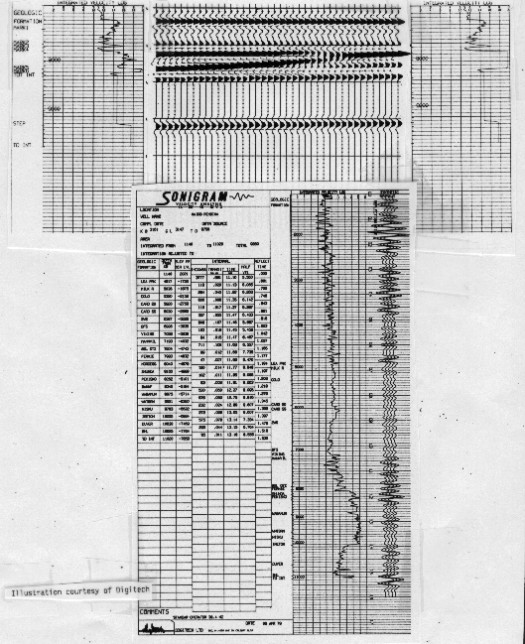
Commercial synthetic seismogram with integrated
sonic log and interval velocity table
Using
the log response equation we
can inject new layers, delete existing layers, replace existing
layers with new ones, change the fluid content from water to gas
or oil (or vice versa). This is called "What-if" modeling.
Models of this type will show why some water zones have bright
spots, why some coal beds have no reflections, and why some carbonate
porosity is visible on seismic (and some is not). What-if models
allow the interpreter to test different structural and stratigraphic
solutions against the actual data before committing to one interpretation.
Another
variant of this modeling method is to replace data, or add data
to the bottom of one well, using log data from another well which
more closely represents the interpreted seismic section. This
data must also be modeled and edited to reflect the unaltered
rock/fluid mixture. This is often done to aid in design of a sidetrack
or whipstock well to find the fault, reef, or salt dome structure
that was missed by the original hole.
As
far as can be determined, FEW existing seismic modeling workstation
performs the necessary log analysis and log recalculation. Therefore
YOU must do it first, offline from the modeling package, and enter
the edited/modeled logs into the system.
|