|
 Triassic Dolomitic Sand
This example is
Exercise 2 from
Crain's Practical Quantitative Log
Analysis for Conventional Reservoirs - a Video
Course for CEOs, geoscientists, engineers, and
petrophysicists looking to improve their oil-finding skills.
This example points out several pitfalls that
can trap inexperienced analysts. First, the high resistivity
at the top of the log segment suggests a great hydrocarbon
show. But this is an anhydrite cap rock with zero porosity.
The density neutron log separation quickly show this. You
need resistive AND porous to have a reservoir.
Second, the pay zones underneath the cap consists
of three thin beds (each about 1.5 to 2 meters thick). It is
tempting to average the porosity over the entire 5 meters. While
this would give a reasonable average porosity and reserves estimate,
it would underestimate the productive capacity of the well by a
factor of about 10. That's because permeability is a function of
porosity to the power 6 and the high porosity streak in the middle
of the reservoir must be analyzed separately to see the tremendous
impact it has on productivity.
Third, this is
not a pure quartz sand and the density porosity by itself
underestimates the effective porosity by 2 to 4% porosity, depending
on the amount of heavy minerals in the sandstone. The quicklook
rules given elsewhere in this Handbook can handle all these
problems, but you have to apply them carefully. Traditional,
over-simplified methods will give extremely pessimistic results, so
don't use them.
Finally, there
is no low resistivity on this log segment, so there is no obvious
water zone. RW must come from another well down dip or from a
catalog value.
rAW
LOGS and PETROPHYSICAL RESULTS for EXERCISE 2
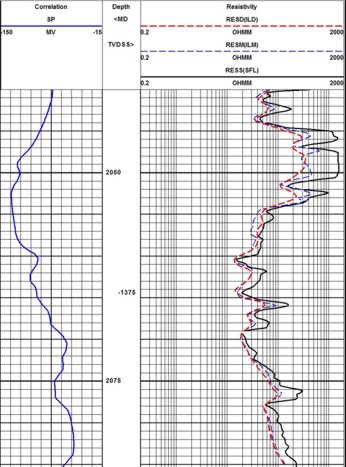 
Raw log data depth plots for Dolomitic Sand
Example. Note how porosity is picked on the peaks because the
beds are thin (2 meters – 6 feet or less). Even then, the log
analysis will underestimate porosity compared to core.
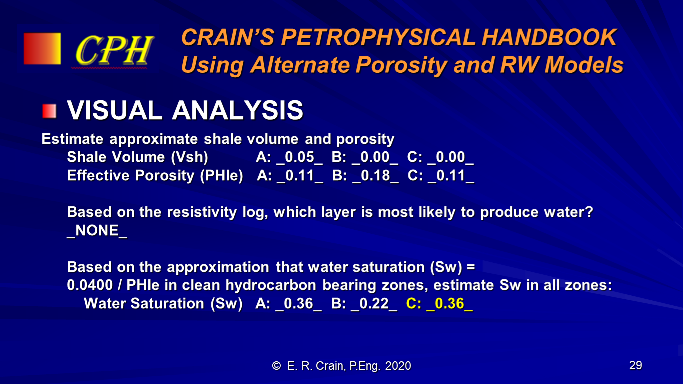
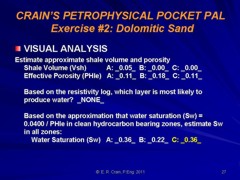
Visual log analysis for Exercise 2, based
on Crain's Rules
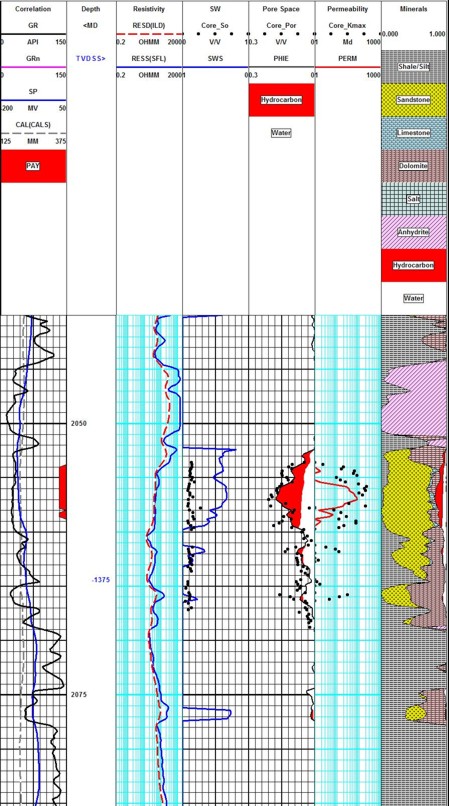
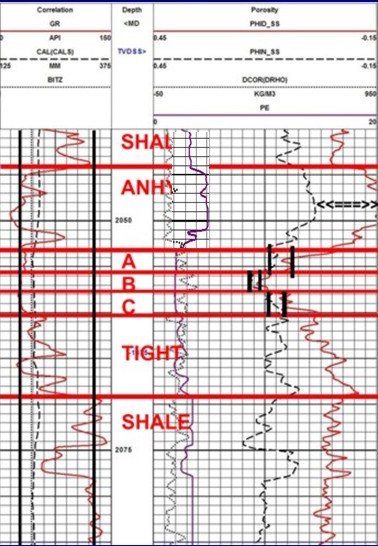
Depth plot for Dolomitic Sand Example. Black dots are
core analysis data. The log does not match
the core as well as we would like, but this is mainly due to
very thin porosity laminations,
thinner than the logging tool resolution.
This example is sandstone with complex
mineralogy. The porosity resistivity overlay will help find the
zone of interest but the high resistivity of the anhydrite cap
and lower shale may be confusing at first. Some people like
simple rules for defining pay zones, such as a resistivity
cutoff. This would not work in this case, or in many other
situations either. The SP also suffers badly from the high
resistivity.
"META/KWIK"
QUICKLOOK SPREADSHEET RESULTS for EXERCISE 2
The best tool for quicklook log analysis is a spreadsheet.
Pick parameters and log data from the raw logs shown above. When
data entry is complete, the answers are instantly available.
Download and use these spreadsheets:
SPR-01 META/KWIK Log Analysis Conventional Oil Gas Bitumenn Metric
SPR-02 META/KWIK Log Analysis Conventional Oil Gas Bitumenn USA
Conventional Oil, Gas,Bitumen
-- shale, porosity, saturation, permeability,
net pay, productivity, reserves.
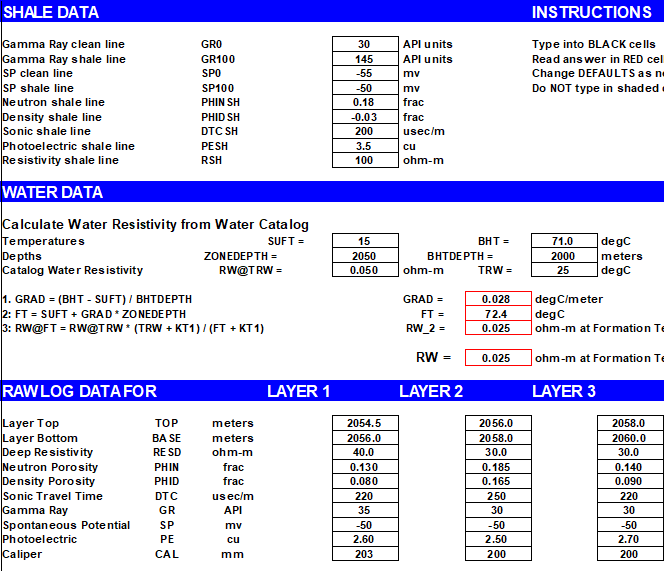
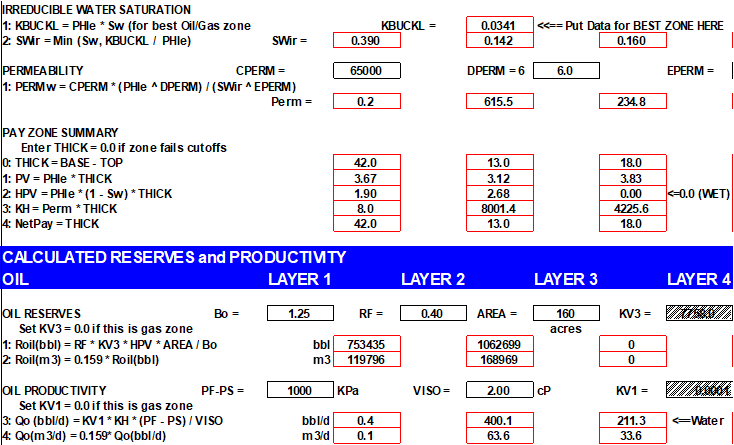
META/KWIK data and results for Exercise 2
"META/LOG ESP" CROSSPLOTS
and
RESULTS for EXERCISE 2
The following crossplots were made using META/LOG ESP, an expert
system on a spreadsheet.
1.
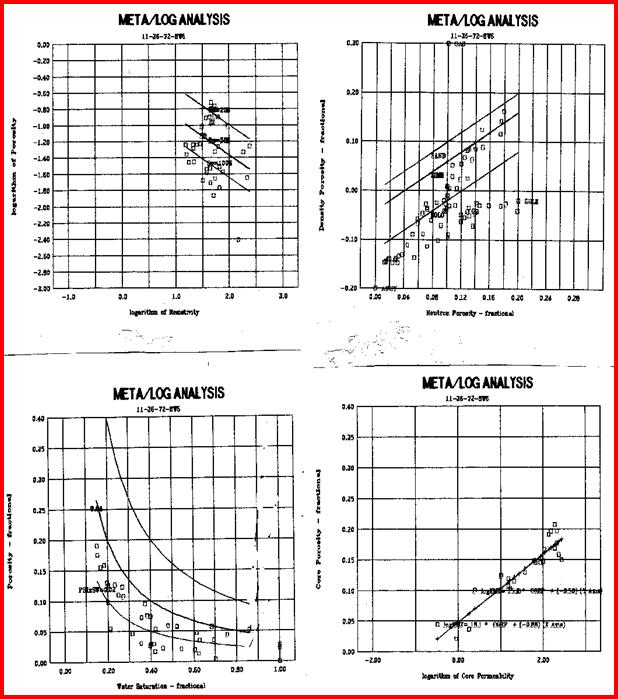
Crossplots for Dolomitic Sand Example
Crossplots help define the lithology and the lack
of a water or transition zone.
1.
Porosity vs Resistivity - shows no
water.
2.
Porosity vs Saturation - shows
constant water volume lines. Data follows one hyperbolic line –
no transition or water zones. Shale data falls to the bottom of
the graph.
3.
Density vs Neutron - shows all data
below sandstone line, indicating either no perfectly clean and
or mixed lithology sand (GR suggests clean sand). Shale data
falls towards bottom and right.
4.
Core porosity vs core permeability
- shows a data distribution that can be used to derive a
regression line mathematically.
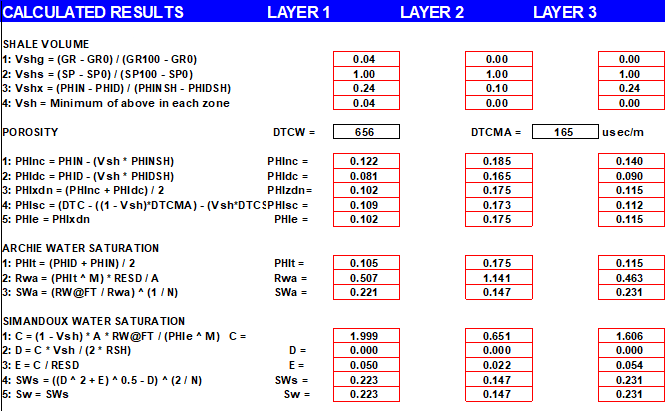
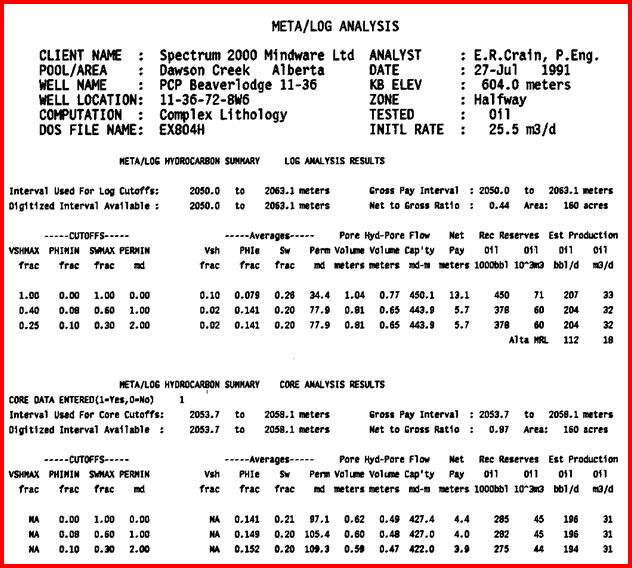
The listings for final results and hydrocarbon
summary are shown below. The log analysis porosity is a little
low and could be increased to match core analysis better by
adjusting the target DENSMA parameter in the META/LOG program.
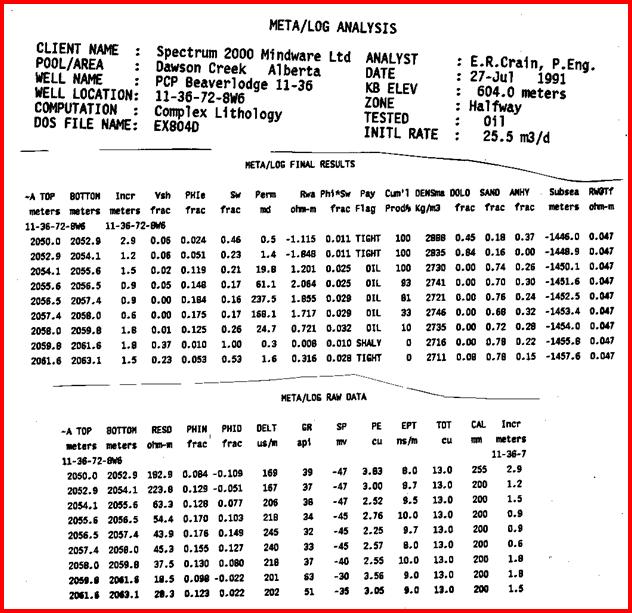
Results and raw data for Dolomitic Sand Example
Summary results of log and core data for Dolomitic Sand
Example
 Notice the very close comparison between the core
porosity (black dots) and log analysis porosity (smooth line)
on the computed log analysis depth plot shown above. Notice the very close comparison between the core
porosity (black dots) and log analysis porosity (smooth line)
on the computed log analysis depth plot shown above.
This is a thin
bed problem as much as a heavy mineral problem, so data in the
porous interval must be picked at very close intervals. The
“peaks and valleys” rule applies. Any form of averaging the data
will mask the contribution of the central porous “hot spot”.
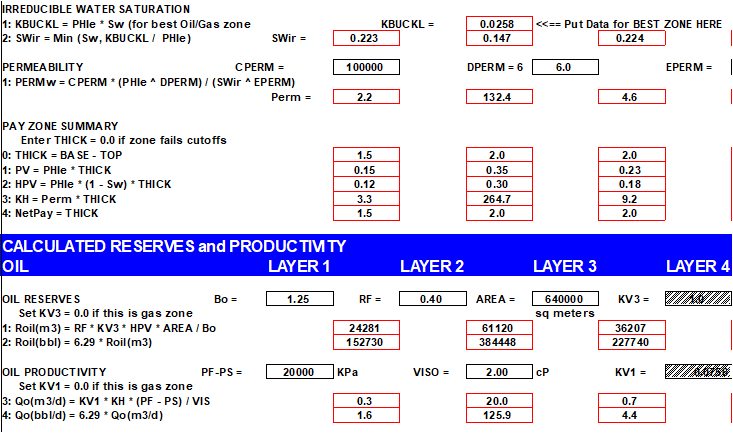
Ninety percent of the productivity comes from this 1.5 meter
interval (2056.5 –2058.0 meters), but it contains only half the
oil in place.
Notice the
excellent permeability versus porosity relationship shown in the
graph at the right.
WELL HISTORY INFO
Pancanadian Beaverlodge 11-36-72-08W6
KB Elev:
689.4 m Logs: DIL-SP, FDC-CNL-GR, BHCS-GR
Log
depths in METERS.
Testing
Record 11-36
DST #2:
2044.0 – 2070.0 m Inflate Straddle
VO: 10.0/45.0 SI: 150.0/249.0 min
FP: 1937.0/2877.0 psi SIP: 3124.4/3101.5 psi HP:
3614.2/3614.2 psi
PMAX:
21686 kPa; BHTEMP: 72 C; Relatively high permeability; no
formation damage;
Blow
description: test run with closed chamber, oil to surface in
30 minutes after blowdown on final flow. Recovery: 323.6 m
clean uncontaminated oil; maximum gas to surface 42793 m3/d
(1.511 mmcf/d)
PRODUCTION HISTORY
 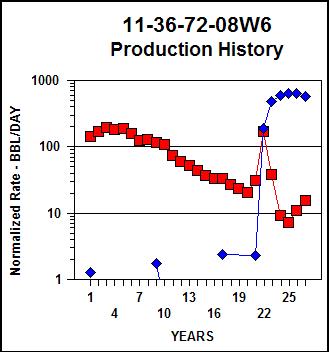 This well had an initial rate of 200 bbl/day and declined
gracefully until year 22 when pump rate This well had an initial rate of 200 bbl/day and declined
gracefully until year 22 when pump rate
was increased,
causing water breakthrough.
Cumulative
production was 429 000 bbl oil and
Over 1 million bbl water. On a logarithmic production scale, the exponential decline is a straight line. The
log analysis predictions are a little high on
recoverable oil and a little low on initial production
rate. Only a minor amount of tuning is required to get both
results to match ground truth.
Linear production scale (above)
shows exponential decline, logarithmic scale (right) shows a
straight line, also demonstrating exponential decline
Listing for Dolomitic Sand Example
Compare your results with the core data on the next page,
especially in the thin high porosity streak 2056.8 to 2058
meters. You will also have to adjust the CPERM parameter in the
permeability equation to get a good match to core. Note that a
conventional shaly sand analysis will under-estimate porosity by
as much as 4% porosity, so the only correct approach is the
shale corrected complex lithology model recommended in this
book. If heavy minerals are not a problem, the complex lithology
model works just as well as the shaly sand model, so there is no
reason to ever use the shaly sand approach..
CORE ANALYSIS DATA FOR 11-36-72-08W6
|
11367208W6 |
|
|
|
|
|
|
|
|
|
|
|
|
S# |
Top |
Base |
Len |
Kmax |
K90 |
Kvert |
Porosi |
GrDen |
BkDen |
Soil |
Swtr |
Lithology |
|
|
meters |
meters |
meter |
mD |
mD |
mD |
frac |
kg/m3 |
kg/m3 |
frac |
frac |
|
|
1 |
2054.35 |
2054.54 |
0.19 |
0.32 |
0.30 |
0.08 |
0.045 |
2881 |
2796 |
0.138 |
0.138 |
DOL INTRANHYARGL |
|
2 |
2054.54 |
2054.74 |
0.20 |
2.45 |
2.38 |
0.41 |
0.100 |
2737 |
2563 |
0.152 |
0.237 |
SS F DOL |
|
3 |
2054.74 |
2054.91 |
0.17 |
20.40 |
20.00 |
0.34 |
0.116 |
2689 |
2493 |
0.147 |
0.118 |
SS F CALC |
|
4 |
2054.91 |
2055.07 |
0.16 |
16.40 |
16.40 |
0.83 |
0.103 |
2706 |
2530 |
0.136 |
0.136 |
SS F CALC |
|
5 |
2055.07 |
2055.26 |
0.19 |
64.50 |
57.70 |
40.30 |
0.145 |
2683 |
2439 |
0.117 |
0.183 |
SS F CALC |
|
6 |
2055.26 |
2055.48 |
0.22 |
60.30 |
58.80 |
37.30 |
0.148 |
2679 |
2431 |
0.124 |
0.198 |
SS F |
|
7 |
2055.48 |
2055.58 |
0.10 |
84.20 |
80.00 |
0.01 |
0.145 |
2700 |
2454 |
0.116 |
0.206 |
SS F |
|
8 |
2055.58 |
2055.74 |
0.16 |
1.77 |
0.31 |
0.03 |
0.037 |
2736 |
2672 |
0.104 |
0.363 |
SS F DOL |
|
9 |
2055.74 |
2055.89 |
0.15 |
10.00 |
10.00 |
4.86 |
0.124 |
2694 |
2484 |
0.156 |
0.208 |
SS F DOL |
|
10 |
2055.89 |
2056.02 |
0.13 |
15.00 |
14.20 |
0.36 |
0.119 |
2695 |
2493 |
0.145 |
0.232 |
SS F DOL |
|
11 |
2056.02 |
2056.21 |
0.19 |
25.40 |
19.10 |
0.07 |
0.099 |
2721 |
2551 |
0.000 |
0.142 |
SS F CALC |
|
12 |
2056.21 |
2056.30 |
0.09 |
15.00 |
0.01 |
0.01 |
0.107 |
2700 |
2518 |
0.188 |
0.263 |
SS F |
|
13 |
2056.30 |
2056.47 |
0.17 |
99.80 |
98.60 |
54.70 |
0.147 |
2696 |
2447 |
0.107 |
0.246 |
SS F |
|
14 |
2056.47 |
2056.75 |
0.28 |
230.00 |
225.00 |
164.00 |
0.158 |
2679 |
2414 |
0.101 |
0.251 |
SS F |
|
15 |
2056.75 |
2056.93 |
0.18 |
189.00 |
170.00 |
67.00 |
0.168 |
2691 |
2407 |
0.098 |
0.245 |
SS F CALC |
|
16 |
2056.93 |
2057.13 |
0.20 |
206.00 |
198.00 |
175.00 |
0.171 |
2678 |
2391 |
0.088 |
0.296 |
SS F |
|
17 |
2057.13 |
2057.37 |
0.24 |
108.00 |
104.00 |
94.10 |
0.166 |
2658 |
2383 |
0.120 |
0.361 |
SS F |
|
18 |
2057.37 |
2057.55 |
0.18 |
152.00 |
141.20 |
82.00 |
0.196 |
2663 |
2337 |
0.115 |
0.298 |
SS F |
|
19 |
2057.55 |
2057.73 |
0.18 |
135.00 |
135.00 |
80.00 |
0.191 |
2672 |
2353 |
0.162 |
0.246 |
SS F V/F |
|
20 |
2057.73 |
2058.01 |
0.28 |
186.00 |
186.00 |
80.00 |
0.207 |
2659 |
2316 |
0.099 |
0.262 |
SS F V/F |
|
21 |
2058.01 |
2058.26 |
0.25 |
37.10 |
36.50 |
0.55 |
0.129 |
2701 |
2482 |
0.095 |
0.219 |
SS F DOL |
|
22 |
2058.26 |
2058.44 |
0.18 |
207.00 |
181.00 |
28.60 |
0.197 |
2683 |
2351 |
0.086 |
0.224 |
SS F |
|
23 |
2058.44 |
2058.62 |
0.18 |
0.90 |
0.29 |
0.01 |
0.022 |
2737 |
2699 |
0.276 |
0.331 |
SS F CALC |
|
24 |
2058.62 |
2058.77 |
0.15 |
271.00 |
237.00 |
5.88 |
0.150 |
2678 |
2426 |
0.081 |
0.359 |
SS F CALC |
|
25 |
2058.77 |
2058.99 |
0.22 |
7.45 |
7.33 |
0.12 |
0.091 |
2701 |
2546 |
0.109 |
0.146 |
SS F DOL |
|
26 |
2058.99 |
2059.20 |
0.21 |
15.70 |
14.00 |
0.06 |
0.098 |
2700 |
2533 |
0.163 |
0.163 |
SS F DOL |
|
27 |
2059.20 |
2059.42 |
0.22 |
27.80 |
18.89 |
4.35 |
0.139 |
2697 |
2461 |
0.162 |
0.223 |
SS F DOL |
|
28 |
2059.42 |
2059.59 |
0.17 |
12.80 |
12.80 |
0.05 |
0.104 |
2710 |
2532 |
0.183 |
0.160 |
SS F DOL |
|
29 |
2059.59 |
2059.76 |
0.17 |
30.90 |
29.60 |
0.01 |
0.075 |
2720 |
2591 |
0.145 |
0.181 |
SS F DOL |
|
30 |
2059.76 |
2059.88 |
0.12 |
77.90 |
77.10 |
68.10 |
0.145 |
2647 |
2408 |
0.086 |
0.205 |
SS F |
|
31 |
2059.88 |
2060.14 |
0.26 |
76.20 |
72.90 |
25.50 |
0.160 |
2666 |
2399 |
0.096 |
0.221 |
SS F |
|
32 |
2060.14 |
2060.34 |
0.20 |
21.50 |
20.30 |
0.10 |
0.185 |
2777 |
2448 |
0.132 |
0.205 |
SS F DOL |
|
33 |
2060.34 |
2060.47 |
0.13 |
12.60 |
11.80 |
0.38 |
0.102 |
2719 |
2544 |
0.177 |
0.155 |
SS F DOL |
|
34 |
2060.47 |
2060.77 |
0.30 |
0.08 |
0.08 |
0.01 |
0.047 |
2716 |
2635 |
0.138 |
0.255 |
SS F DOL ARGL |
|
35 |
2060.77 |
2060.95 |
0.18 |
0.13 |
0.07 |
0.01 |
0.055 |
2712 |
2618 |
0.000 |
0.535 |
SS F DOL |
|
36 |
2060.95 |
2061.10 |
0.15 |
|
0.01 |
0.01 |
|
|
|
|
|
SHALE |
|
37 |
2061.10 |
2061.26 |
0.16 |
0.02 |
0.01 |
0.01 |
0.031 |
2752 |
2698 |
0.000 |
0.504 |
SS F DOL ARGL |
|
38 |
2061.26 |
2061.52 |
0.26 |
0.03 |
0.01 |
0.01 |
0.047 |
2743 |
2661 |
0.000 |
0.505 |
SS F DOL |
|
39 |
2061.52 |
2061.71 |
0.19 |
0.05 |
0.01 |
0.01 |
0.012 |
2720 |
2699 |
0.000 |
0.622 |
SS F DOL |
|
40 |
2061.71 |
2061.94 |
0.23 |
|
0.01 |
0.01 |
|
|
|
|
|
SHALE |
|
41 |
2061.94 |
2062.07 |
0.13 |
0.02 |
0.01 |
0.01 |
0.027 |
2773 |
2725 |
0.000 |
0.534 |
SS F DOL |
|
42 |
2062.07 |
2062.31 |
0.24 |
3.31 |
3.20 |
1.32 |
0.084 |
2707 |
2564 |
0.155 |
0.217 |
SS F DOL |
|
43 |
2062.31 |
2062.54 |
0.23 |
8.80 |
8.38 |
3.62 |
0.121 |
2735 |
2525 |
0.096 |
0.119 |
SS F DOL |
|
44 |
2062.54 |
2062.67 |
0.13 |
12.90 |
11.30 |
6.41 |
0.132 |
2800 |
2562 |
0.103 |
0.144 |
SS F DOL ANHY |
|
45 |
2062.67 |
2062.92 |
0.25 |
0.90 |
0.80 |
0.01 |
0.077 |
2737 |
2603 |
0.108 |
0.108 |
SS F DOL |
|
46 |
2062.92 |
2063.09 |
0.17 |
0.37 |
0.37 |
0.04 |
0.057 |
2726 |
2628 |
0.167 |
0.232 |
SS F DOL |
|
47 |
2063.09 |
2063.26 |
0.17 |
0.54 |
0.53 |
0.13 |
0.080 |
2731 |
2593 |
0.107 |
0.215 |
SS F DOL |
|
48 |
2063.26 |
2063.39 |
0.13 |
1.51 |
1.40 |
0.62 |
0.077 |
2721 |
2588 |
0.134 |
0.205 |
SS F DOL |
|
49 |
2063.39 |
2063.64 |
0.25 |
0.42 |
0.37 |
0.17 |
0.074 |
2717 |
2590 |
0.116 |
0.143 |
SS F DOL |
|
50 |
2063.64 |
2063.89 |
0.25 |
0.29 |
0.28 |
0.03 |
0.074 |
2741 |
2612 |
0.149 |
0.275 |
SS F DOL |
|
51 |
2063.89 |
2064.00 |
0.11 |
0.18 |
0.16 |
0.02 |
0.050 |
2701 |
2616 |
0.084 |
0.189 |
SS F DOL |
|
52 |
2064.00 |
2064.17 |
0.17 |
0.26 |
0.23 |
0.09 |
0.061 |
2720 |
2615 |
0.048 |
0.240 |
SS F DOL |
|
53 |
2064.17 |
2064.31 |
0.14 |
0.16 |
0.04 |
0.01 |
0.031 |
2772 |
2717 |
0.123 |
0.197 |
SS F DOL ARGL |
|
54 |
2064.31 |
2064.46 |
0.15 |
0.13 |
0.09 |
0.03 |
0.059 |
2743 |
2640 |
0.138 |
0.277 |
SS F DOL |
|
55 |
2064.46 |
2064.64 |
0.18 |
0.02 |
0.02 |
0.01 |
0.039 |
2755 |
2687 |
0.000 |
0.314 |
SS F DOL ARGL |
|
56 |
2064.64 |
2064.80 |
0.16 |
0.06 |
0.05 |
0.01 |
0.028 |
2736 |
2687 |
0.000 |
0.406 |
SS F DOL |
|
57 |
2064.80 |
2064.96 |
0.16 |
0.12 |
0.09 |
0.01 |
0.046 |
2740 |
2660 |
0.000 |
0.270 |
SS F DOL |
|
58 |
2064.96 |
2065.19 |
0.23 |
|
0.01 |
0.01 |
|
|
|
|
|
SHALE |
|
59 |
2065.19 |
2065.39 |
0.20 |
0.08 |
0.05 |
0.01 |
0.061 |
2782 |
2673 |
0.000 |
0.622 |
DOL P/S ANHYSD |
|
60 |
2065.39 |
2065.53 |
0.14 |
1.27 |
1.18 |
0.10 |
0.081 |
2783 |
2639 |
0.089 |
0.221 |
DOL P/S ANHYSD |
|
61 |
2065.53 |
2065.71 |
0.18 |
1.78 |
1.56 |
0.29 |
0.074 |
2802 |
2669 |
0.087 |
0.134 |
DOL P/S ANHYSD |
|
62 |
2065.71 |
2065.87 |
0.16 |
0.32 |
0.32 |
0.02 |
0.060 |
2783 |
2676 |
0.000 |
0.565 |
DOL P/S ARGLSD |
|
63 |
2065.87 |
2066.08 |
0.21 |
0.28 |
0.24 |
0.04 |
0.065 |
2791 |
2675 |
0.054 |
0.108 |
DOL P/S ANHYSD |
|
64 |
2066.08 |
2066.15 |
0.07 |
0.18 |
0.01 |
0.01 |
0.077 |
2780 |
2643 |
0.000 |
0.054 |
DOL P/S SD CHT |
|
65 |
2066.15 |
2066.54 |
0.39 |
0.18 |
0.15 |
0.01 |
0.041 |
2849 |
2773 |
0.100 |
0.125 |
DOL P/S ANHYSD |
|
66 |
2066.54 |
2066.67 |
0.13 |
30.90 |
28.10 |
2.28 |
0.156 |
2815 |
2532 |
0.119 |
0.089 |
DOL P/S ANHYSD |
|
67 |
2066.67 |
2066.82 |
0.15 |
13.30 |
10.20 |
2.18 |
0.108 |
2774 |
2582 |
0.115 |
0.064 |
DOL P/S SD |
|
68 |
2066.82 |
2067.10 |
0.28 |
4.62 |
2.34 |
1.52 |
0.092 |
2787 |
2623 |
0.108 |
0.108 |
DOL P/S ANHYSD |
|
69 |
2067.10 |
2067.34 |
0.24 |
0.36 |
0.19 |
0.01 |
0.039 |
2831 |
2760 |
0.047 |
0.047 |
DOL P/S H/F ANHYSD |
|
70 |
2067.34 |
2067.57 |
0.23 |
0.06 |
0.04 |
0.01 |
0.033 |
2804 |
2744 |
0.096 |
0.479 |
DOL PP/VANHYSD |
|
71 |
2067.57 |
2067.59 |
0.02 |
|
0.01 |
0.01 |
|
|
|
|
|
SHALE |
|
72 |
2067.59 |
2067.86 |
0.27 |
0.07 |
0.07 |
0.01 |
0.040 |
2758 |
2688 |
0.139 |
0.312 |
SS VF DOL ARGL |
|
73 |
2067.86 |
2067.87 |
0.01 |
|
0.01 |
0.01 |
|
|
|
|
|
SHALE |
|
74 |
2067.87 |
2068.04 |
0.17 |
0.05 |
0.05 |
0.01 |
0.033 |
2752 |
2694 |
0.092 |
0.459 |
SS VF DOL ARGL |
|
75 |
2068.04 |
2068.29 |
0.25 |
0.16 |
0.15 |
0.01 |
0.067 |
2761 |
2643 |
0.000 |
0.610 |
SS F DOL |
|
76 |
2068.29 |
2068.54 |
0.25 |
0.04 |
0.04 |
0.01 |
0.025 |
2782 |
2737 |
0.000 |
0.396 |
SS F DOL |
|
77 |
2068.54 |
2068.76 |
0.22 |
0.05 |
0.04 |
0.01 |
0.031 |
2754 |
2700 |
0.000 |
0.284 |
SS F DOL |
|
78 |
2068.76 |
2068.91 |
0.15 |
0.02 |
0.02 |
0.01 |
0.027 |
2795 |
2747 |
0.000 |
0.360 |
SS F DOL |
|
79 |
2068.91 |
2069.10 |
0.19 |
0.11 |
0.03 |
0.01 |
0.016 |
2753 |
2725 |
0.000 |
0.427 |
SS F DOL |
|
80 |
2069.10 |
2069.39 |
0.29 |
0.04 |
0.02 |
0.01 |
0.024 |
2803 |
2760 |
0.000 |
0.600 |
SS F DOL ARGLPRY |
|
81 |
2069.39 |
2069.68 |
0.29 |
0.02 |
0.02 |
0.01 |
0.019 |
2794 |
2760 |
0.000 |
0.382 |
SS F DOL ANHY |
|
|
|
|
|
|
|
|
|
|
|
|
|
|
|
Arithmetic Averages |
0.19 |
33.0 |
28.8 |
12.8 |
0.089 |
2735 |
2582 |
0.091 |
0.268 |
|
|
|
|
|
|
|
|
|
|
|
|
|
|
|
Core data listing for Dolomitic Sand Exercise
2
|