Selections
should be made on a consistent basis from day to day to assist
reproducibility of results. When using digital log data, the digits
themselves will be used by the computer program, but the analyst
must still pick numerous values by observation of log curves,
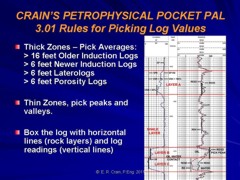
crossplots, or data listings. To select a log value, it is helpful, especially for the novice, to "box the log". Draw horizontal lines at each bed boundary, at the inflection points on each curve. Draw vertical lines on each curve at the peaks and valleys, thus transforming the log into a series of individual beds with a single specific log reading. For thicker reservoir layers, an average value may be chosen if the log curve does not wiggle too much.
With experience, it is possible to simply mark points at the peaks and valleys without drawing horizontal lines, as shown in the lower part of the example. Unless absolutely necessary, values should not be selected on slopes. Slopes indicate transition from one condition, such as porosity or hydrocarbon content, to another. Average values, halfway along the slope may be meaningful, but can also be misleading. Do not select values in thin beds unless you are also prepared to make bed thickness corrections. Be sure to pick the correct curve, its appropriate scale, and edit any noise or bad hole conditions prior to finalizing values. Write the log values picked into a table or preprinted form so that you will have a record of the data you are using. Note that very shaly zones are not usually interpreted. Therefore, this data can be left off the table or marked as shale with no data values entered.
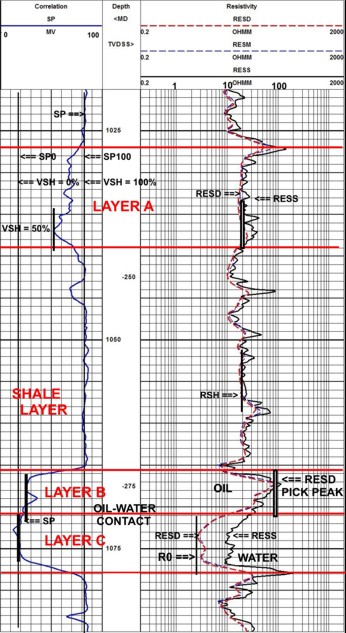
SHALY SAND EXAMPLE –
Depths in Feet
(Logs above were in meters)
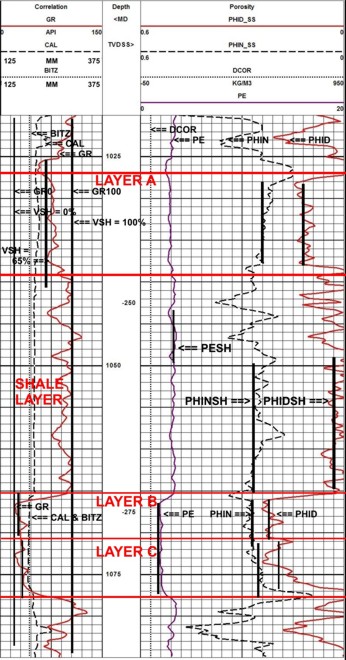
Shale Properties: Gamma Ray shale line (GR100) ___105___ api units SP clean line (SP0) ____14___ mv SP shale line (SP100) ____78___ mv Density shale line (PHIDSH) __0.03___ Neutron shale line (PHINSH) __0.26___ Sonic shale line (DTCSH) ___NA___ us/m Resistivity shale line (RSH) ___20____ ohm-m Resistivity of Water Zone (R0) ___2.7___ ohm-m
Layer
Top
__3364_ _3499_ _3512__ feet
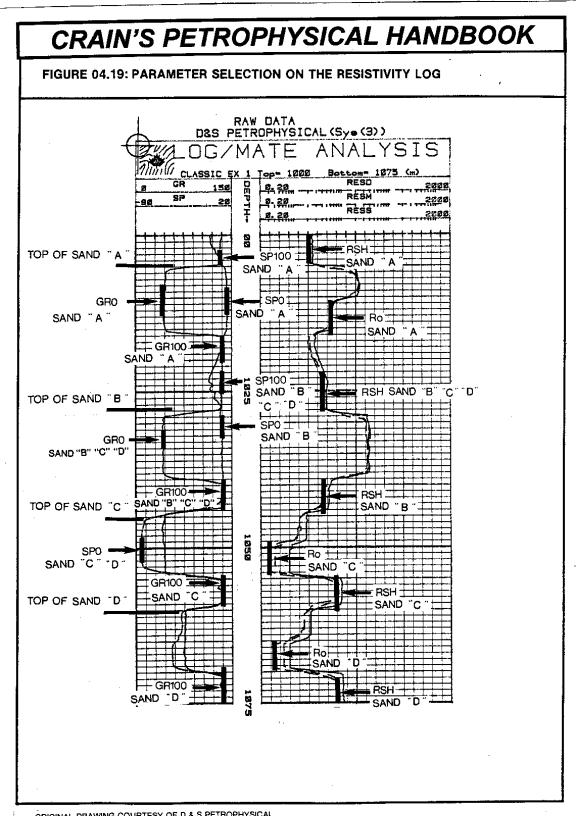
In order to perform a log analysis, it is necessary to read or pick log values in the various zones of interest, and other key locations, such as in shale or water bearing zones. Selections should be made on a consistent basis from day to day to assist reproducibility of results.
In computer aided log analysis, picks are made continuously with a digitizer or by reading magnetic tapes created when the logs were recorded. Such data tends to be more accurate than hand picked values. Accuracy can be a hindrance on noisy logs, rounded bed boundaries, or in large or rough holes. Some editing or curve shaping may be required prior to digitizing, hand picking data, or using tape-recorded data.
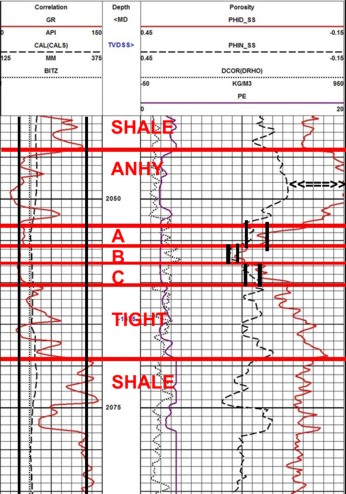
To select a log value it is helpful, especially for the novice, to "box the log". Draw horizontal lines at each bed boundary, at the inflection points on each curve. In thinner beds, draw vertical lines on each curve at the peaks and valleys, thus transforming the log into a series of individual beds with a single specific log reading. Pick peaks or valleys in thin beds to get the best possible values.
On thicker beds, draw a line through the average value of the curve. It is necessary to create a new bed or layer each time the porosity changes by 2% (porosity units), or when resistivity or gamma ray change by more than 10% (relative units)
The rule is to draw bed boundaries at the top and bottom of each clean zone, then draw boundaries at the porosity breaks within each clean zone. Finally draw any new boundaries needed to accommodate resistivity changes, which usually represent oil or gas water interfaces. The major interval between the top and bottom boundary of a relatively clean rock is called a ZONE. Each boundary inside a ZONE defines a LAYER of rock. Each layer will be analyzed separately by picking log values for each layer, called "Reading the Log"..
For thick layers, pick average values. For porosity, gamma ray, laterolog, and array induction logs, "thick" means more than 6 feet (2 meters). For older style induction logs, "thick means greater than 15 feet (5 meters).
In thick
beds, pick average values
Old style induction log, layer
roughly
Unless absolutely necessary, values should not be selected on slopes. Slopes indicate transition from one condition, such as porosity or hydrocarbon content, to another. Average values, halfway along the slope may be meaningful, but can also be misleading. Do not select values in thin beds unless you are also prepared to make bed thickness corrections.
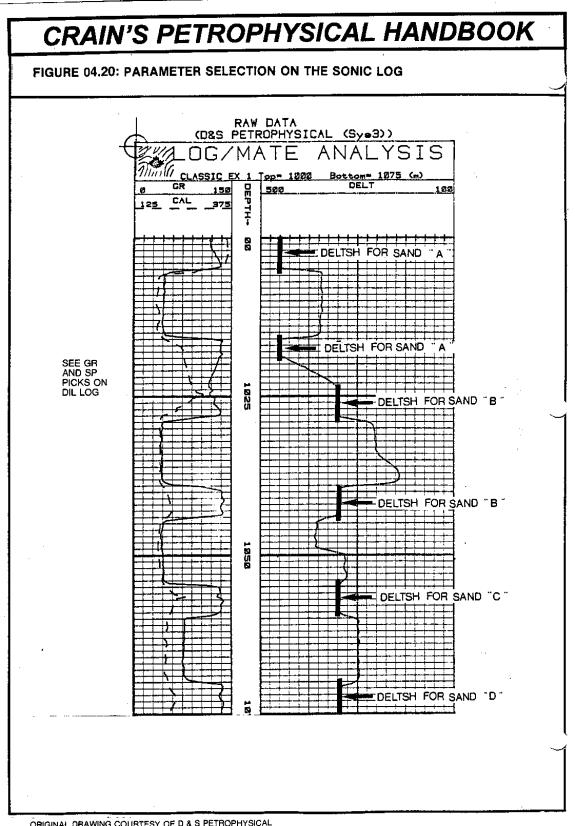
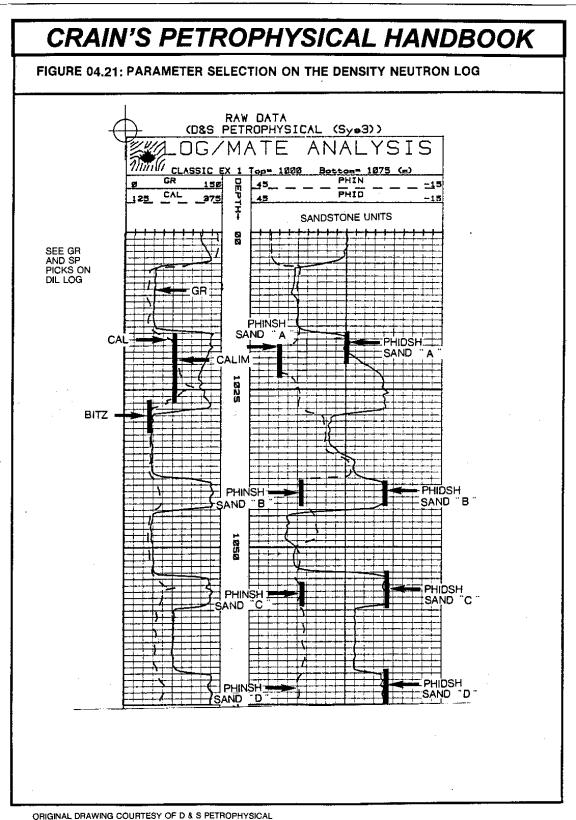
Fluid values for various analysis methods are generally obtained in a laboratory environment and adjusted for temperature, pressure, and salinity as required. They cannot generally be picked directly from logs. Matrix rock values are normally available from handbooks or data tables. The numbers usually represent log readings for pure minerals, which rarely exist in real situations. The values may also be found by inspecting logs if relatively pure, zero porosity zones are present. Some crossplots may assist in finding matrix parameters. Due to varying shale compositions, shale values are not as well known or as constant as for other rock minerals. They are often found by inspecting logs in a shale bed near the zone being interpreted. Some crossplots may assist in finding matrix parameters. In order to pick a parameter, the expected values must be known approximately. Only then is it possible to determine if the value seen on the log or the crossplot is reasonable and representative of the parameter required. This may involve evaluating several wells to gain confidence in making assumptions. Suggested methods for selecting parameters through log inspection are illustrated below and in the following discussion. 1. Shale resistivity is the average value of the deepest resistivity curve reading in shale, 20 feet or more thick, below the zone in question. If the well does not penetrate a shale below the zone of interest, or if a major geological boundary is crossed, use the shale immediately above the zone. 2. Resistivity in a water zone is the lowest value of the deepest resistivity curve reading in a water zone, 20 feet or more thick, below the zone to be interpreted. The value may be slightly to 2 or 3 times too high. It is used to determine water resistivity for water saturation calculations. 3. It is usually impossible to obtain matrix values from observation of log data alone. Matrix values for the sonic, density, and neutron logs are used to correct for the effects of the varying lithology. Find the lowest consistent value of sonic travel time, lowest density, porosity, (or highest density), and lowest neutron porosity in the zone to be interpreted. If these values are close to the expected matrix value for the known lithology, they may be used with caution. If lithology is unknown, start with pure mineral values from tables. 4. Shale values for sonic, density, and neutron are determined from the average value of logs in shales, 20 or more feet thick, below the zone to be interpreted. This applies to clean logs without skips, spikes, and rough or large boreholes. Caution should be used since shale properties can vary widely within a short interval. Data is used for shale corrections to porosity calculations. Therefore, corrections may be inaccurate if shale properties vary or are poorly chosen. 5.Gamma ray readings in shale are usually reasonably high (100 - 200 API units and lower in sandstones and carbonates (10 - 50 API units). SP scales vary widely, but deflections to the left usually represent sandstones and deflections to the right mean shale, except in shallow fresh water sands. The SP is usually featureless in carbonates. 6. The gamma ray and SP clean sand and shale lines are required to allow us to find the shale volume for use in shale corrections to porosity calculations. To determine the clean line value, find the cleanest or least shaly zone in the entire well. Lower this value to suit the known shale content in other zones. Caution - never push the clean line into more than 5% of the data points. To find the shale line, draw a line through the average data value in thick shale zones. Do not include very radioactive zones which are generally caused by uranium, and not shale minerals. Up to 10% of the data points may be above the shale line.
If
base line methods are difficult, certain crossplots may be
helpful.
Some analysts prefer the crossplot method although it requires
an extra computer step and is not appropriate for visual or quick
look interpretation. Crossplots also mask variations related to
depth, so appropriate zoning is required. |
|
||
|
Page Views ---- Since 01 Jan 2015
Copyright 2023 by Accessible Petrophysics Ltd. CPH Logo, "CPH", "CPH Gold Member", "CPH Platinum Member", "Crain's Rules", "Meta/Log", "Computer-Ready-Math", "Petro/Fusion Scripts" are Trademarks of the Author |
|||

|
||
| Site Navigation | PETROPHYSICS COURSE CRAIN'S RULES FOR PICKING WELL LOG DATA VALUES | Quick Links |