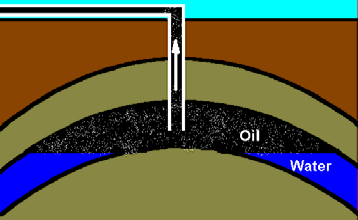
In some wells, a tar mat exists just above the original oil/water contact. There is little moveable oil in the tar mat. During production, aquifer influx or water flooding can position water above the tar mat, giving rise to an oil/water/tar mat/water profile. In
tar sands, it is possible to have gas over water over oil, because
the oil is heavier than the water. A particular well may not penetrate the water zone due to the structure of the trap. Some reservoirs have no water leg and thus no transition zone and no water contact. Infill wells drilled into older reservoirs may encounter secondary gas caps, deeper gas caps, or shallower water contacts that were not present when the reservoir was discovered. Both current and original contacts may be visible on logs, but differences between their signatures may be very subtle. For example, a secondary gas cap may contain immobile oil, reducing the amount of gas crossover. Zones swept by aquifer influx will contain residual oil, so water saturation will not be 100%. Zones swept by a waterflood are especially difficult to detect because the injected water may be much more resistive than the original formation water. Running and analyzing TDT or pulsed neutron logs to find water contact changes over time is called reservoir monitoring. By combining dated water contacts from both cased hole and open hole logs, a clearer picture of reservoir performance can be obtained.
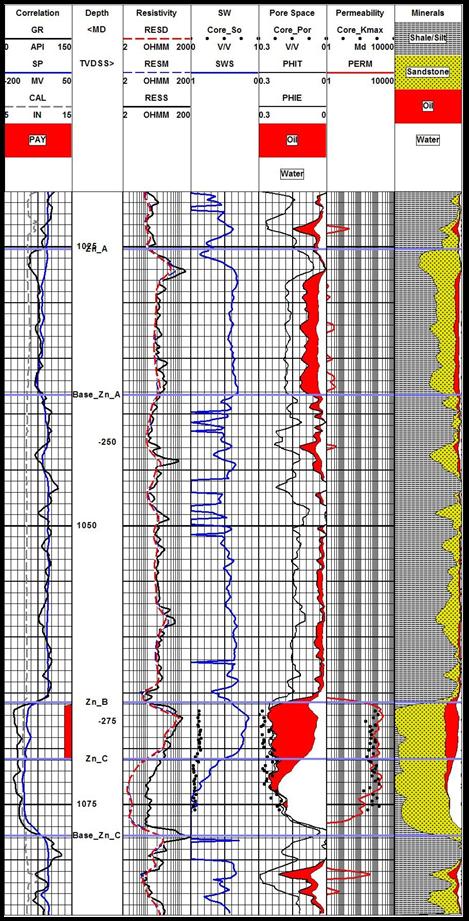
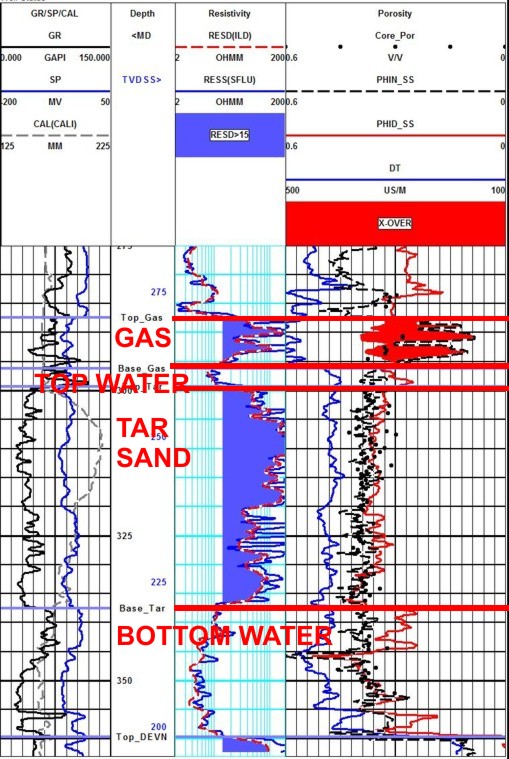
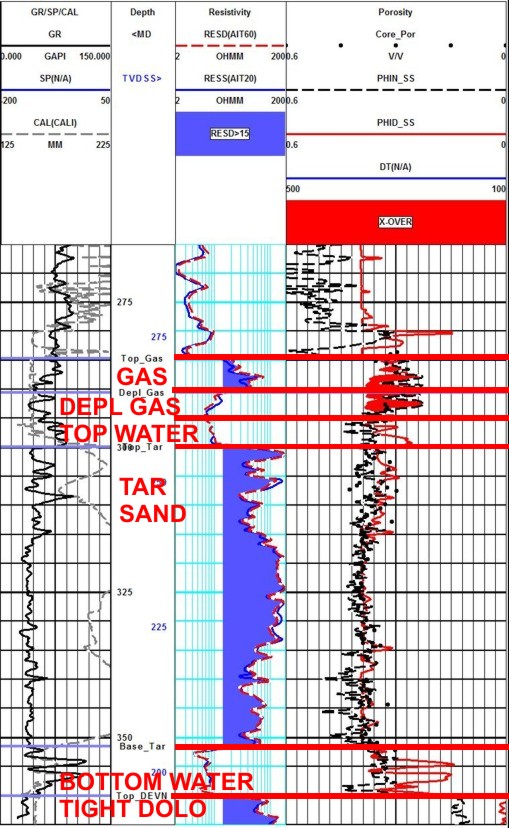
In such cases, top of transition zone must be determined by drill stem or production tests. Saturation cutoffs must be adjusted to agree with test results. The example shown below show two interpretations of the transition zone in a complex reservoir. The producing interval is shown by the narrow black bar near the bottom of the porous interval. Since water cut is less than 6%, the second interpretation is the correct one; the first interpretation would suggest a much higher water cut from this perforated interval.
The steps shown in the saturation curve represent pore geometry changes caused by progressively increasing isolated vugs deeper in the reservoir. The porosity times water saturation product defines different "rock types' or pore geometry facies. These are shown best in a porosity vs water saturation crossplot with different colours indicate the different facies.
1. Gas/oil or gas/water contacts are picked at the point below which gas crossover on the shale and matrix corrected density neutron log disappears. Perforations just below this depth will produce gas with water or gas with oil. Perforations above this depth should produce mostly gas. Gas crossover on recorded logs can be masked by shale or heavy mineral effects. The best way to look for crossover in these cases is to create shale corrected logs, rescaled for the density of the minerals in the zones and display these curves on depth plots. In gas filled dolomite reservoirs, this is the only way to see the gas crossover - such log displays can be made in the field on the logging truck if you suspect gas and dolomite might be present. 2. Oil/water contact is at the depth where water saturation first reaches (close to) 100%. This sometimes called the free water level (FWL). Perforations below this point will produce 100% water. This can usually be picked on the resistivity log where resistivity reaches its lowest values in a clean, porous reservoir. Shaliness, varying porosity, and residual oil, or bitumen may mask this pick. A clearly defined contact in one well may be located in a shale in an offset well. 3. Top of transition zone is picked at the depth above which the bulk volume water (and usually water saturation) becomes nearly constant or reaches its minimum value. Perforations below this point will produce oil with some water or 100% water if oil viscosity is high. Water saturation in this zone may still be quite low and may pass cutoffs. Since some of the oil in the transition zone may be pushed upward by an active aquifer, some operators count all this oil in their reservoir volume. Others count only down to an arbitrary water saturation (say 50%) while others stop counting at the top of transition or even higher. Water saturation in the transition zone is above irreducible water saturation, which is usually demonstrated by the production characteristics or drill stem tests on these intervals. CAUTION: Top of transition may be masked by changes in pore geometry or shaliness, as shown in the example given above. Perforating
too close to a gas/oil or oil/water contact will cause problems.
The drawdown pressure caused by production will allow gas to flow
down into perfs near the gas. Similarly, water can be drawn up
to co-mingle with oil production. Problems can be especially severe
in fractured reservoirs, and can be disastrous if management is
greedy or stupid about desired flow rates.
The older well (left) shows gas
crossover (shaded red) and moderate resistivity (shaded blue above
20 ohm-m) over 15+ meters of gas pay. Below is a water sand (low
resistivity and no crossover). Below that is the oil sand (high
resistivity, shaded blue). The gas-water contact is confirmed by the
base of the high resistivity and by the base of the crossover. If no
water zone was present, only base of crossover would indicate the
contact. Gas production was begun immediately upon well
completion. The moral of the tale is that gas
crossover can be misleading. First, prove it is gas and not bad hole
condition or sandstone on a limestone scale. Second, check that the
zone is resistive enough to still have a reasonably attractive water
saturation. Then test the zone to be sure. |
|
||
|
Page Views ---- Since 01 Jan 2015
Copyright 2023 by Accessible Petrophysics Ltd. CPH Logo, "CPH", "CPH Gold Member", "CPH Platinum Member", "Crain's Rules", "Meta/Log", "Computer-Ready-Math", "Petro/Fusion Scripts" are Trademarks of the Author |
|||

|
||
| Site Navigation | WATER SATURATION FLUID CONTACTS GAS OIL WATER | Quick Links |
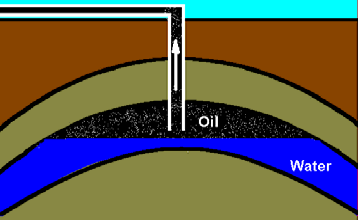
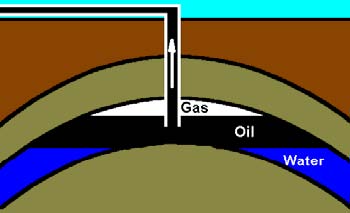 Contacts
in gas expansion drive: Oil / Water. Initial conditions. After
some production Gas / Oil contact drops.
Contacts
in gas expansion drive: Oil / Water. Initial conditions. After
some production Gas / Oil contact drops.