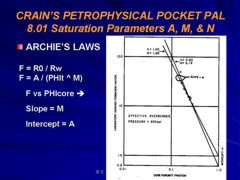
He also found that F varied with porosity:
For a tank of water, R0 = Rw. Therefore F = 1.
Since PHIt = 1, then A must also be 1.0 and M can have any
value. If porosity is zero, F is infinite and both A and M can
have any value. However, for real rocks, both A and M vary with
grain size, sorting, and rock texture. The normal range for A is
0.5 to 1.5 and for M is 1.7 to about 3.2. Archie used A = 1 and
M = 2. In fine vuggy rock, M can be as high as 7.0 with a
correspondingly low value for A. In fractures, M can be as low
as 1.1. Note that R0 is also spelled Ro in the literature. This
relationship is illustrated below:
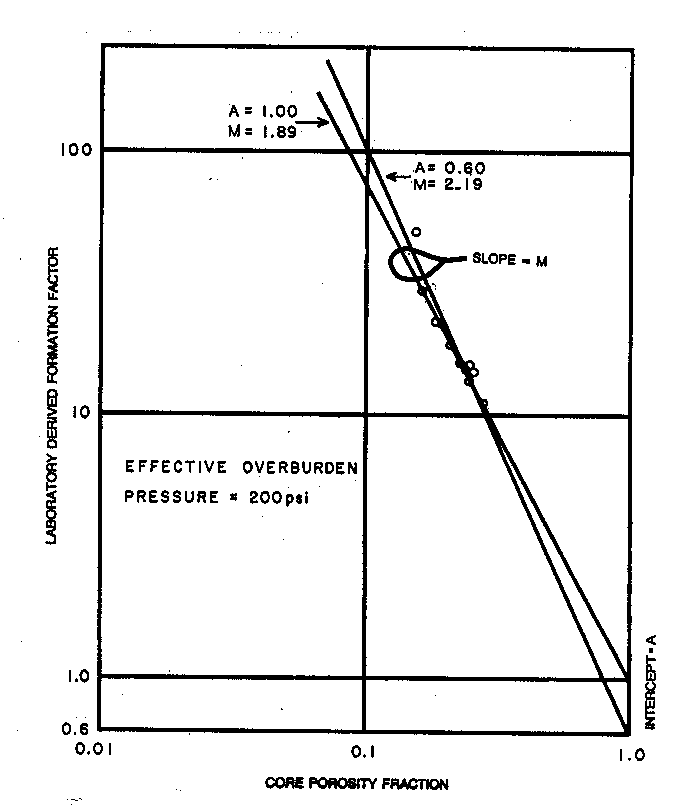
Formation Factor versus Porosity plot to find saturation parameters A and M.
Archie initially proposed that A = 1.0, M = 2.0, and N = 2.0; later it was found that these values varied with rock type. When electrical properties are available, they should be used, provided they fall within reasonable ranges and the data set is large enough to be valid. Data is usually presented in tabular as well as graphical form, as shown below.
The slope of the best fit line
through the formation factor data is the cementation exponent,
M. The best fit line can be forced through the origin (a pinned
line) which makes the tortuosity factor A = 1.0 exactly. The
intercept of the best fit (un-pinned) line will give A; in this
example A = 0.60. Data should be grouped by rock type, porosity
type, or mineralogy, before the best fit lines are determined.
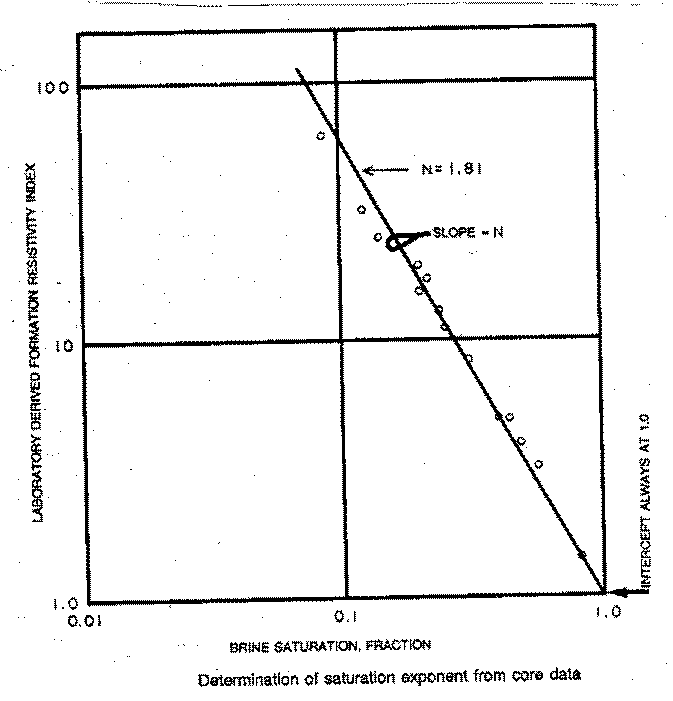
Archie used an N of 2 and the usual range is from 1.3 to 2.6, depending on rock texture. It is often taken to equal M, but this is not supported by core data in all cases. Rearrangement of these four equations give the more usual Archie water saturation equation This relationship is illustrated below:
The value for the saturation exponent N is usually found in the laboratory as shown above. It is a plot of resistivity index ( I ) versus water saturation. Several partial saturations are taken on each core plug and N is determined from the slope of the line through these points. N can be varied by defining lithofacies for each core plug and relating this to some log signature.
The best fit line on this plot is always pinned at the origin, since resistivity index must equal 1.0 when SW = 1.0, by definition.
Shale corrections are applied by adding a shale conductivity term with an associated shale porosity and shale formation factor relationship. Numerous authors have explored this approach, leading to numerous potential solutions for water saturation.
Where: For
quick analysis use carbonate values. Values for local situations
should be developed from special core data. Results will always
be better if good local data is used instead of traditional values,
such as those given above.
|
|
||
|
Page Views ---- Since 01 Jan 2015
Copyright 2023 by Accessible Petrophysics Ltd. CPH Logo, "CPH", "CPH Gold Member", "CPH Platinum Member", "Crain's Rules", "Meta/Log", "Computer-Ready-Math", "Petro/Fusion Scripts" are Trademarks of the Author |
|||

|
||
| Site Navigation | WATER SATURATION ARCHIE'S LAWS | Quick Links |