|
 Environmental Corrections for Resistivity
Water saturation calculations require a good value for formation
resistivity, commonly called true resistivity or Rt, as well as
shale corrected porosity (PHIe), and the shale content (Vsh). Therefore, the
resistivity log may need some environmental corrections before
use in the saturation equations.
The
corrections on this page are for older style induction logs and
laterologs, and are shown for illustration purposes only. Use the
appropriate charts for the specific tool that was run on your well.
Note that invasion corrections, covered in the next Section, apply
only to water zones and oil zone cases have not been published
anywhere. On modern array induction logs, invasion corrections for
both water and oil zone cases are applied by the service company to
create Rt and Rxo curves. These algorithms have not been published.
Commercial log analysis software may use generic or obsolete
environmental corrections, so care in the use of these corrections
is required. No software package has individual corrections for
every possible tool type from all service companies.
Borehole
corrections for mud salinity and hole diameter should be applied
first, if needed. Most computer aided log analysis software has
this capability. Fortunately, borehole corrections can often be
safely ignored when the log is run in a good borehole with a good
mud system. The newest array induction logs attempt to produce
Rt with all corrections applied. Do not over correct your data
by applying the corrections a second time.
Borehole Environment Corrections to Resistivity
For
those who insist on superfluous detail, formulae are provided
here for the deep induction log for 1.5 inches standoff, the usual case:
Borehole correction for deep induction - standoff
= 1.5 inches
Note
that the abbreviations shown above are those used in this FORTRAN
program and do not conform to abbreviations used in this Handbook.
Hole size is in inches and correction to the code for metric dimensions
is required. Charts for these formulae are given below for various tool types.
Borehole correction for medium induction log
Borehole correction for deep induction log
Borehole correction for deep laterolog (dual)
Borehole correction for shallow laterolog (dual)
Borehole correction for laterolog (single)
It
is instructive to determine the borehole corrections for some
typical cases and run a sensitivity study with one of the saturation
equations to see if the corrections have a measurable impact.
Induction Log Borehole Corrections
IES ang DIL ONLY
The
borehole signal for induction logs is subtracted from the induction
conductivity measurement and reciprocated to obtain corrected
resistivity.
1: RESDc = 1000 / (1000 / RESD - BHGD)
2: RESMc = 1000 / (1000 / RESM - BHGM)
Where:
BHGD = deep resistivity correction (mS/m)
BHGM = medium resistivity correction (mS/m)
RESD = deep resistivity reading (ohm-m)
RESDc = deep resistivity corrected for borehole effect (ohm-m)
RESM = medium resistivity reading (ohm-m)
RESMc = medium resistivity corrected for borehole (ohm-m)
COMMENTS:
The values for BHGD and BHGM are to be taken from
charts similar to those shown below, or from curve fits to these charts. Some computer programs
use a look-up table. These charts are for Schlumberger’s
6FF40 tool. Different charts and look-up tables are needed for
other induction logging tool designs.
Laterolog Borehole Corrections
DLL Only
The
borehole correction for laterologs is a correction factor which
is divided into the original log reading to obtain the corrected
value.
3: RESDc = RESD / CFD
4: RESMc = RESM / CFM
5: RESEDITFLAG$ = "BH"
Where:
CFD = borehole effect correction factor for deep laterolog
CFM = borehole effect correction factor for shallow laterolog
RESD = deep resistivity reading (ohm-m)
RESDc = deep resistivity corrected for borehole effect (ohm-m)
RESM = medium resistivity reading (ohm-m)
RESMc = medium resistivity corrected for borehole (ohm-m)
COMMENTS:
The values for CFD and CFM are to be taken from
appropriate charts, or from curve fits to these charts. Some computer programs
use a look-up table. These charts are for Schlumberger’s
DLL tool. Different charts and look-up tables are needed for other
laterolog tool designs.
Invasion Corrections
The
second correction is for the effects of invasion of mud filtrate
into the formation. Knowledge of the invasion profile can be used
to correct the deep resistivity log for this effect. The profile
knowledge comes from the medium and shallow resistivity data when
compared to the deep resistivity. Correction charts are
available for various tool types, and are usually known as
Tornado Charts due to the shape of the lines on the graph.
Sometimes the log data does not fit inside the body of lines on the
chart. A pragmatic solution is to lower the deep resistivity by a an
offset based on the difference between the logarithm of the shallow
resistivity and the logarithm of the medium resistivity. An example
is shown below. The equations to run standard invasion corrections
follow. Note the warning at the end of this section.
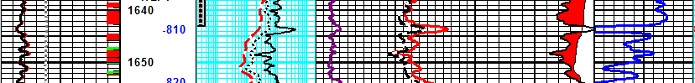
Original logs showing deep invasion on resistivity, with hydrocarbon
volume (shaded red) and water saturation based on the deep
resistivity as recorded.
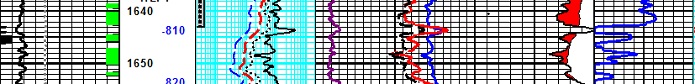
Invasion corrected deep resistivity (dashed purple) is a linear
shift of the logarithm of the original deep resistivity (dashed
red). Note that the water zone now looks wet, the zone no longer
triggers a pay flag, and original hydrocarbon -- water contact is
now more clearly defined in this depleted reservoir.
In the above example, the need for
invasion corrections is inferred from the fact that no oil or gas
was produced from the perforations annotated at the top of the zone.
If hydrocarbons had been produced, the deep resistivity would need
to be increased. The published Tornado Charts for induction logs
never increase resistivity, so they are meant only for wet or
depleted intervals.
Invasion Correction for Induction Logs
The
invasion corrections for dual induction logs are computed as follows:
6: IF RESD < RESM
7: AND IF RESM < RESS
8: THEN H = RESS / RESD - 1
9: B = RESM / RESD - 1
10: C = H / B
11: D = 0.59 * H - 2.21 * C + 1.35
12: E = - 1.44 * H + 2.47 * C - 2.76
13: G = - 0.5 * ((D ^ 2 - 4 * E) ^ 0.5 + D)
14: IF RESD >= RESM
15: OR IF RESM >= RESS
16: THEN G = 1.0
17: RESDc = G * RESD
Where:
B = intermediate term
C = intermediate term
D = intermediate term
E = intermediate term
G = intermediate term
H = intermediate term
RESD = deep resistivity log reading (ohm-m)
RESDc = deep resistivity log reading corrected for invasion (ohm-m)
RESM = medium resistivity log reading (ohm-m)
RESS = shallow resistivity log reading (ohm-m)
COMMENTS:
If the medium and deep resistivity logs read the same value, then
either no correction is needed because invasion is very shallow,
or no correction is possible because invasion is extremely deep.
These formulae are shown graphically below. Newer tools
need different charts.
RESDc
is often called Rt, the "true" resistivity - see warning
below.
NUMERICAL
EXAMPLE:
1. For example, the data for Sand D gives:
RESS = 2.0
RESM = 1.5
RESD = 1.0
H = 2.0 / 1.0 - 1 = 1.0
B = 1.5 / 1.0 - 1 = 0.5
C = 1.0 / 0.5 = 2.0
D = 0.59 * 1.0 - 2.21 * 2.0 + 1.35 = -2.48
G = - 0.5 * ((2.48 ^ 2 - 4 * 0.74) ^ 0.5 - 2.48) = 0.35
RESDc = 0.35 * 1.0 = 0.35
Thus,
invasion is so deep that the dual induction reads nearly three
times too high. If this is a water zone, the correction is reasonable.
If it is hydrocarbon bearing, the correction makes no sense.
Invasion correction for dual induction
CRAIN'S
OPINIONATED OPINION
CAUTION: The invasion correction for induction logs as defined
by service company charts always reduces Rt. This is fine
in a water zone but is dead wrong in oil or gas zones, where
Rt is usualy too low due to invasion of water. Lowering
it even more is just too dumb for words. Therefore, DO NOT
apply invasion corrections from these charts in hydrocarbon
zones. Most software allows you to turn off these offensive
corrections. |
Below
is a sample sensitivity analysis that shows the correction factor
Rt/RESD is greater than 1.0 for many real situations. The same
factor (Rt/Rild) on above graph is never greater than 1.0.
SENSITIVITY
ANALYSIS
WATER
SATURATION AND RESISTIVITY WITH INVASION
|
|
|
Archie's
Equation |
| |
Sw
= (A * RW@FT / (PHIe ^ M) / Rt) ^ (1 / N) |
| |
|
|
Assume
A=1.0, M = N = 2.0 |
| |
Sw
= (RW@FT / (PHIe ^ 2) / Rt) ^ 0.5 |
| |
|
|
Rearrange
terms |
| |
Sw^2
= (RW@FT / (PHIe ^ 2) / Rt) |
| |
|
|
Solve
for Rt in uninvaded oil zone |
| |
Rt=
(RW@FT / (PHIe ^ 2) / Sw^2) |
| |
|
|
Solve
for Rxo in invaded oil zone |
| |
Rxo=
(RMF@FT / (PHIe ^ 2) / Sxo^2) |
| |
|
|
Solve
for R0 in uninvaded water zone |
| |
R0=
(RW@FT / (PHIe ^ 2) |
| |
|
|
Assume
RESD gets 50% of signal from invaded zone and 50%
from uninvaded zone |
| |
RESD
= 1 / ((1 / Rt + 1 / Rxo) / 2) |
| |
|
|
Solve
for SWa in invaded oil or water zone |
| |
Swa
= (RW@FT / (PHIe ^ 2) / RESD) ^ 0.5 |
| |
|
|
Multiply
deep resistivity (RESD) by Rt/RESD ratio to obtain
Rt from RESD |
|
|
INVADED
OIL ZONE Sw=0.25 RMF@FT=1.000 |
|
Sxo=0.6 |
Sxo=0.8 |
Sxo=1.0 |
Sw=1.0 |
| |
|
|
|
|
|
|
|
|
|
|
|
RW@FT |
PHIe |
Rt |
Rxo |
R0 |
RESD |
SWa |
Rt/RESD |
Rt/RESD |
Rt/RESD |
Rt/RESD |
|
0.25 |
0.25 |
64.0 |
44.4 |
4.0 |
52.5 |
0.28 |
1.22 |
1.78 |
2.50 |
0.63 |
|
0.25 |
0.15 |
177.8 |
123.5 |
11.1 |
145.7 |
0.28 |
1.22 |
1.78 |
2.50 |
0.63 |
|
0.10 |
0.25 |
25.6 |
44.4 |
1.6 |
32.5 |
0.22 |
0.79 |
1.01 |
1.30 |
0.55 |
|
0.10 |
0.15 |
71.1 |
123.5 |
4.4 |
90.2 |
0.22 |
0.79 |
1.01 |
1.30 |
0.55 |
|
0.03 |
0.25 |
7.7 |
44.4 |
0.5 |
13.1 |
0.19 |
0.59 |
0.65 |
0.74 |
0.52 |
|
0.03 |
0.15 |
21.3 |
123.5 |
1.3 |
36.4 |
0.19 |
0.59 |
0.65 |
0.74 |
0.52 |
|
|
INVADED
OIL ZONE Sw=0.25 RMF@FT=0.50 |
|
Sxo=0.6 |
Sxo=0.8 |
Sxo=1.0 |
Sw=1.0 |
| |
|
|
|
|
|
|
|
|
|
|
|
RW@FT |
PHIe |
Rt |
Rxo |
R0 |
RESD |
SWa |
Rt/RESD |
Rt/RESD |
Rt/RESD |
Rt/RESD |
|
0.25 |
0.25 |
64.0 |
22.2 |
4.0 |
33.0 |
0.35 |
1.94 |
3.06 |
4.50 |
0.75 |
|
0.25 |
0.15 |
177.8 |
61.7 |
11.1 |
91.6 |
0.35 |
1.94 |
3.06 |
4.50 |
0.75 |
|
0.10 |
0.25 |
25.6 |
22.2 |
1.6 |
23.8 |
0.26 |
1.08 |
1.52 |
2.10 |
0.60 |
|
0.10 |
0.15 |
71.1 |
61.7 |
4.4 |
66.1 |
0.26 |
1.08 |
1.52 |
2.10 |
0.60 |
|
0.03 |
0.25 |
7.7 |
22.2 |
0.5 |
11.4 |
0.21 |
0.67 |
0.81 |
0.98 |
0.53 |
|
0.03 |
0.15 |
21.3 |
61.7 |
1.3 |
31.7 |
0.21 |
0.67 |
0.81 |
0.98 |
0.56 |
|
|
INVADED
OIL ZONE Sw=0.25 RMF@FT=0.25 RMF@FT |
|
Sxo=0.6 |
Sxo=0.8 |
Sxo=1.0 |
Sw=1.0 |
| |
|
|
|
|
|
|
|
|
|
|
|
RW@FT |
PHIe |
Rt |
Rxo |
R0 |
RESD |
SWa |
Rt/RESD |
Rt/RESD |
Rt/RESD |
Rt/RESD |
|
0.25 |
0.25 |
64.0 |
11.1 |
4.0 |
18.9 |
0.46 |
3.38 |
5.62 |
8.50 |
1.00 |
|
0.25 |
0.15 |
177.8 |
30.9 |
11.1 |
52.6 |
0.46 |
3.38 |
5.62 |
8.50 |
1.00 |
|
0.10 |
0.25 |
25.6 |
11.1 |
1.6 |
15.5 |
0.32 |
1.65 |
2.55 |
3.70 |
0.70 |
|
0.10 |
0.15 |
71.1 |
30.9 |
4.4 |
43.0 |
0.32 |
1.65 |
2.55 |
3.70 |
0.70 |
|
0.03 |
0.25 |
7.7 |
11.1 |
0.5 |
9.1 |
0.23 |
0.85 |
1.11 |
1.46 |
0.56 |
|
0.03 |
0.15 |
21.3 |
30.9 |
1.3 |
25.2 |
0.23 |
0.85 |
1.11 |
1.46 |
0.56 |
|
|
INVADED
OIL ZONE Sw=0.25 RMF@FT=0.10 RMF@FT |
|
Sxo=0.6 |
Sxo=0.8 |
Sxo=1.0 |
Sw=1.0 |
| |
|
|
|
|
|
|
|
|
|
|
|
RW@FT |
PHIe |
Rt |
Rxo |
R0 |
RESD |
SWa |
Rt/RESD |
Rt/RESD |
Rt/RESD |
Rt/RESD |
|
0.25 |
0.25 |
64.0 |
4.4 |
4.0 |
8.3 |
0.69 |
7.70 |
13.30 |
20.5 |
1.75 |
|
0.25 |
0.15 |
177.8 |
12.3 |
11.1 |
23.1 |
0.69 |
7.70 |
13.30 |
20.5 |
1.75 |
|
0.10 |
0.25 |
25.6 |
4.4 |
1.6 |
7.6 |
0.46 |
3.38 |
5.62 |
8.50 |
1.00 |
|
0.10 |
0.15 |
71.1 |
12.3 |
4.4 |
21.0 |
0.46 |
3.38 |
5.62 |
8.50 |
1.00 |
|
0.03 |
0.25 |
7.7 |
4.4 |
0.5 |
5.6 |
0.29 |
1.36 |
2.04 |
2.90 |
0.65 |
|
0.03 |
0.15 |
21.3 |
12.3 |
1.3 |
15.6 |
0.29 |
1.36 |
2.04 |
2.90 |
0.65 |
|
| |
Invasion Correction for Laterologs
The
invasion corrections for dual laterologs are computed as follows:
18: IF RESD / RESS <= 1
19: THEN RESDc = 1.7 * RESD - 0.7 * RESM
20: IF RESD / RESM >= 1.1
21: THEN RESDc = 1.1 * RESD
22: C = RESM / RESS * (RESD - RESS) / (RESD - RESM)
23: IF C = 1 / 1.7
24: THEN RESDc = RESD
25: IF C # 1 / 1.78
26: THEN RESDc = 2.18 * C * RESD / (1.78 * C - 1)
27: OTHERWISE RESDc = RESD
Where:
C = intermediate term
RESD = deep resistivity log reading (ohm-m)
RESDc = deep resistivity log reading corrected for invasion (ohm-m)
RESM = medium resistivity log reading (ohm-m)
RESS = shallow resistivity log reading (ohm-m)
COMMENTS:
If the medium and deep resistivity logs read the same value, then
either no correction is needed because invasion is very shallow,
or no correction is possible because invasion is extremely deep.
These formulae are shown graphically below. Newer tools
need different charts.
Invasion correction for dual laterolog
This
chart can raise or lower the Rt. Use the correction only if the
correction raises Rt. The reader is encouraged to run a sensitivity
analysis, similar to the one shown earlier for induction logs,
for the laterolog in a salt mud case and a fresh mud case.
NUMERICAL
EXAMPLE:
1. Assume a dual laterolog had been run, the log might have read:
RESD = 2.0
RESM = 1.5
RESS = 1.0
C = 1.5 / 1.0 * (2.0 - 1.0) / (2.0 - 1.5) = 3.00
RESDc = 2.18 * 3.00 * 2.0 / (1.78 * 3.00 - 1) = 3.00
Calculating Diameter of Invasion
The invasion correction described above can also be used to calculate
an apparent invasion diameter (Di). On some modern logs, this
result is calculated by the service company. The generic formulae are:
For dual induction logs:
30: C = (RESM / RESDc) * (RESD - RESDc) / (RESM - RESD)
31: Di = 33 * (C + 1) - min (100, 10 ^ (0.5 * C - 0.04))
For dual laterolog:
32: IF RESDc / RESD > 1
33: THEN Di = 10 ^ (RESDc / RESD
- 1)
34: IF RESDc / RESD < 1
35: THEN Di = 160 * (1 - RESD / RESDc)
36:: OTHERWISE Di = 0.0
Where:
Di = diameter of invasion (inches)
RESD = deep resistivity log reading (ohm-m)
RESDc = corrected deep resistivity reading (ohm-m)
RESM = medium resistivity log reading (ohm-m)
COMMENTS:
Di is
in inches; multiply by 25.4 to get millimeters.
If RESDc / RESD = 1; Di cannot be determined.
While
diameter of invasion is not used to correct other data, it is
a useful quality control indicator.
NUMERICAL
EXAMPLE:
1. Data for Sand D gives:
RESS = 2.0
RESM = 1.5
RESD = 1.0
RESDc = 0.35 from previous example
C
= (1.5 / 0.35) * (1.0 - 0.35) / (1.5 - 1.0) = 5.57
Di = 33 * (5.57 + 1) - min (100, 10 ^ (0.5 * 5.57 - 0.04)) = 116
inches
|