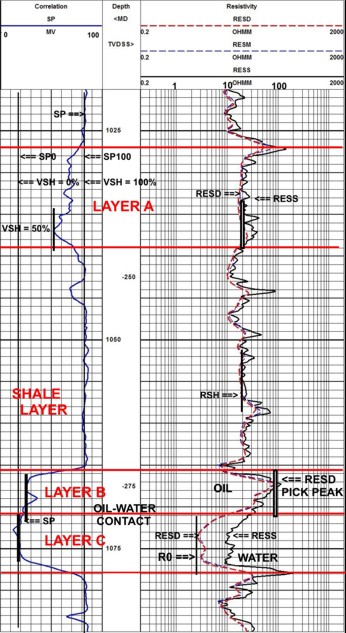
Here's how to start. First,
annotate the resistivity and porosity logs to identify the clean and
shale lines , then draw horizontal lines to represent the bed
boundaries, as shown below.
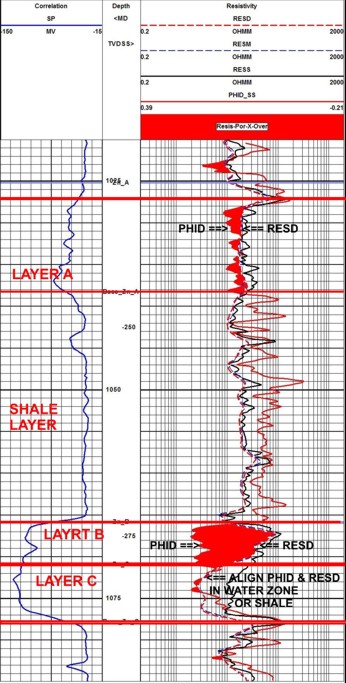
When the porosity and resistivity both deflect in the same direction, they are said to be "tracking" each other. When they deflect in opposite directions, they are "Not tracking". The easiest way to see this artifact is to trace the porosity log onto the resistivity log, as shown in the illustration below:
Raw logs showing resistivity porosity overlay. Red shading indicates porosity-resistivity crossover and possible hydrocarbon zones. The density or density porosity (solid red curve) is placed on top of the deep resistivity curve (dashed red curve). Line up the two curves so that they lie on top of each other in obvious water zones. If there are no obvious water zones, line them up in the shale zones. If the porosity curve falls to the LEFT of the resistivity curve, as in Layers A and B, hydrocarbons are probably present. Layer B is an obvious oil zone based on it's high resistivity and high porosity. Layer A is less obvious because both the resistivity and the porosity are lower, but they deflect in opposite directions, so hydrocarbons are very likely. Layer C is an obvious water zone.
OR
Low
resistivity with moderate to high porosity usually indicates
water or shale.
OR
High
resistivity with moderate to high porosity usually indicates
hydrocarbons.
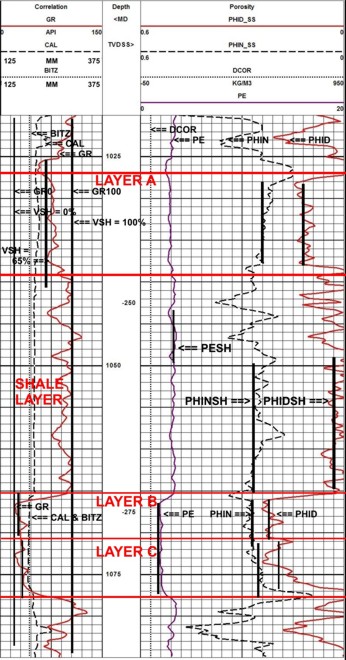
The average of density and neutron porosity in Layers B is 24 %; Layer C is 19%. This is close to the final answer because there is not much shale in these zones. The average in Layer A is 16 % - much higher than the truth due to the influence of the shale in the zone. The density porosity is about 11%, pretty close to the core data. Therefore all our analysis must make use of shale correction methods.
Low resistivity and high porosity usually means water, as in Layer C. Known DST, production, or mud log indications of oil or gas are helpful indicators.
Layer B and Layer A show crossover when the porosity is traced on the resistivity log, so these zones remain interesting. In fresher water formations, it is often difficult or impossible to spot hydrocarbons visually. If it was easy, log analysts would be out of work!
Crossover on the density neutron log sometimes means gas (not seen on the above example). Watch for rough hole problems, sandstone recorded on a limestone scale, or limestone recorded on a dolomite scale, which can also show crossover – not caused by gas.
Water zones with high porosity and low resistivity are called “obvious water zones”. Fresh water may look like hydrocarbons, particularly in shallow zones. The lack of SP development will often help distinguish fresh water zones. Low porosity water zones may not be obvious.
Low resistivity pay zones are usually found by observation of oil in the mud system, oil or gas shows on the gas log, oil staining in samples or cores, and some by accident. Low resistivity pay is caused by one or more of the following: conductive minerals (clay or pyrite), laminated shaly sands, laminated porosity, very fine grained rock (silt) with high irreducible water saturation, often associated with high water salinity.
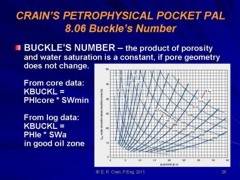
Water saturation is usually calculated from the Archie equation or a shale corrected version of it. This is not easy to do with mental arithmetic. An easier estimate of water saturation can be made in obvious hydrocarbon zones by using a method attributed to Buckle, and it is commonly used by reservoir engineers in a hurry.
CAUTION: If the logs had been recorded on a limestone scale, there would always be some crossover in a clean sandstone, whether there was gas or not. Conversely, a gas filled limestone will infrequently show crossover if it is recorded on a sandstone scale, but it will (usually) if recorded on a limestone scale. Similarly, a dolomite logged on a limestone scale (a common occurrence) will show no crossover because the lithology effect is larger than the gas effect. The same well logged on a dolomite scale (not so common) will show crossover if the zone is dolomite and filled with gas, but also if the zone is limestone or sandstone without gas. Care should be taken to account for logging scales and lithology when using the crossover technique. Because of the large matrix effect due to dolomite, crossover can seldom be seen in dolomitic limestone, dolomitic sandstone, or pure dolomite unless an appropriate scale shift is made to the density and neutron logs. In the absence of a computer, this may be accomplished by overlaying the density and neutron curves in known oil or water zones, and looking for crossover that might indicate gas or limestone above or below the water or oil zones.
Other indicators of hydrocarbons such as gas or oil in the mud, a gas or mud log at the well site with shows of oil and gas, drill stem test results, production from offset wells, and sample or core staining or fluorescence, are often relied upon to narrow down the possible zones which may contain hydrocarbons. All the data in the well history is therefore very important to the log analyst. Sonic
log skipping may be an indicator of gas in the formation or in
the mud, or a fractured formation, but may be due only to poor
logging instruments or poor quality control. It is hoped that
logs are run to minimize skipping and the log analyst should not
rely on the presence of skips to indicate gas. |
|
||
|
Page Views ---- Since 01 Jan 2015
Copyright 2023 by Accessible Petrophysics Ltd. CPH Logo, "CPH", "CPH Gold Member", "CPH Platinum Member", "Crain's Rules", "Meta/Log", "Computer-Ready-Math", "Petro/Fusion Scripts" are Trademarks of the Author |
|||

|
||
| Site Navigation | WATER SATURATION CRAIN'S RULES FOR VISUAL ANALYSIS | Quick Links |
 Density Neutron Crossover may show gas