|
 geothermal ENERGY
Basics
geothermal ENERGY
Basics
Geothermal energy is a well established member of the Green
Economy using many technical skills borrowed from the oil
and gas industry, including drilling, logging, well
completions, and of course petrophysics. This article
describes basic geothermal concepts and illustrates the
petrophysical aspects with extracts from several published
case histories.
Geothermal energy has two distinct meanings. One is
electrical power generation using medium and high
temperature water or steam from wells drilled into the
Earth’s subsurface. The virtue of this method is that it
produces a constant base load of electricity, while wind,
wave, and solar methods offer only intermittent or variable
output. The logging tools and petrophysical analysis
techniques developed for oilfield work are equally
applicable to geothermal exploration and development.
The other meaning is the use of low temperature geothermal
heat pumps (GHPs) for space heating or water heating
applications in homes and small industrial settings. Such
systems involve a continuous loop of plastic pipe buried
about 2 feet below the frost line in an area beside the
building to be heated. A pump and heat exchanger are
connected to the pipe and a fluid is circulated through the
system. Most internet searches will pop up dozens of
webpages offering to sell and install these systems for your
home or business. GHPs are of no direct interest to
petrophysicists.
Geothermal power projects are classified "High Temperature”, above 150 degrees C and up to 260
C or more OR "Medium Temperature”, below 150 degrees C and down to
about 60 C. The high temperature systems drive. Steam
turbines directly; medium temperature systems use a heat
exchanger and a secondary fluid with a low boiling point to
drive the turbine. High temperatures are found near
volcanoes,
dormant or not, and the lower values in the deeper portions
of sedimentary basins.
|
UnitS conversionS |
|
Energy - Joules (J)
1 Joule = 0.2338 Cal
1 Cal = 4.187 J
1 kWh (kiloWatt.hour) = 3.6 MJ
1 MWy (MegaWatt year) = 31.56
TJ
1 BTU (British thermal unit) =
1055 J
1 barrel of oil equivalent =
5.7 GJ
1 tonne of oil equivalent = 42
GJ
1 m3
of
natural gas = 38 MJ
Power - Watts (W)
1 W = 1 J/s
1 W = 3.412 BTU/Hr
1 kW (kiloWatt) = 1.341
horse-power
Heat Flow - Watt per sq. metre (W/m2)
1 W/m2
= 0.2388 x10^-5 cal/cm2sec
1 cal/cm2
sec = 41.87 kW/m2
Geothermal gradient - Kelvin/metre (K/m)
1 mK/m = 1 C/km
1 mK/m = 0.5486 x 10^-3 F/ft
Thermal Conductivity - Watts/metre. Kelvin
(W/mK)
1 W/mK = 2.39 x10³ cal/cm sec C
Range: Coal = 0.3, Water = 0.6, Rocks = 1.5 to 4.0,
Metals = 40 to 400 W/mK.
Prefixes: SI Units
k kilo 10^3 m
milli 10^-3
M Mega 10^6
u micro 10^-6
G Giga 10^9
n nano 10^-9
T Tera 10^12
p pico 10^-12
P Peta 10^15
E Exa 10^18
|
High temperature systems come in two flavours: dry steam plants, which directly use
geothermal steam to turn turbines, and flash steam plants,
which pull deep, high-pressure hot water into lower-pressure tanks
and use the resulting flashed steam to drive turbines back into the
reservoir.
Geothermal reservoirs are described as "Conventional" when
they are hot, wet, porous, permeable, often fractured, OR "Unconventional"
when they are hot, dry, non-porosous, non-permeable, no natural fractures.
Conventional geothermal reservoirs are exploited by producing hot
water or steam from the reservoir and disposing of the spent steam
to the atmosphere or condensing and injecting it back to the
reservoir. Typical oilfield practices are used to enhance
production, such as hydraulic fracturing and horizontal wells,
provided the temperature does not exceed the limits of available
technology.
Unconventional geothermal reservoirs are often called Enhanced (or
Engineered) Geothermal Systems (EGS) or "hot, dry rock" reservoirs.
They require hydraulic fracturing and horizontal wells to obtain a
flow path through which water can be circulated in a closed loop.
To add more complexity, it should be possible to extract lithium
from the natural brines in conventional geothermal reservoirs as they pass through the plumbing before
or after passing through the turbines.
The heat generation in a geothermal reservoir comes from
proximity to plutonic rock or the
continuously supplied by radioactive decay in or below
the reservoir.
The properties of heat and heat transfer are not usually part of
a petrophysicist's lexicon. The table at the right covers some of
the basic terms and units of measurement. Source: GSC Open
File 5906
è
Heat content is expressed in uW/m3 (microWatts per cubic
meter). Normal values range from undetectable to 10 uW/m3.
A single geothermal well-pair can produce a few to more than 10 megaWatts
of power. That's enough to cover the base load electricity demand of
about 1000 homes without creating any significant greenhouse gases (GHGs).
A project to service a city would be a major undertaking. But a good
number of larger units using medium temperature sedimentary
reservoirs combined with wind and solar would go a long way to
reduce GHGs.
Capital costs for conventional geothermal are about twice that of a
similar gas fired plant. Drilling accounts for over half the costs,
and exploration of deep resources entails significant risks. A
typical well-pair can support 4.5 megawatts (MW) of electricity
generation and costs about $10 million to drill. In total,
electrical station construction and well drilling costs $2 – 5
million per MW of electrical capacity, while the energy cost is
$0.04 – 0.10 per kW·h. Enhanced geothermal systems are on the high
side of these ranges, with capital costs above $4 million per MW and
costs above $0.054 per kW·h in 2007 dollars.
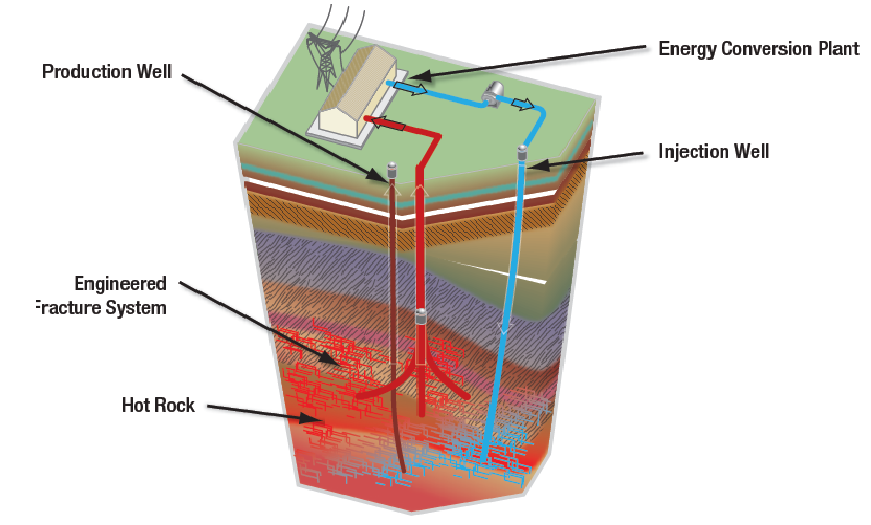
Schematic diagram of geothermal energy system. The "hot rock"
portion, shown in red, could be porous, permeable, and fractured,
making a conventional geothermal reservoir. Or it could be tight and
un-fractured -- subsequent drilling of horizontal wells and hydraulic
stimulation could be used to exploit this type of unconventional
geothermal reservoir. (USGS image)
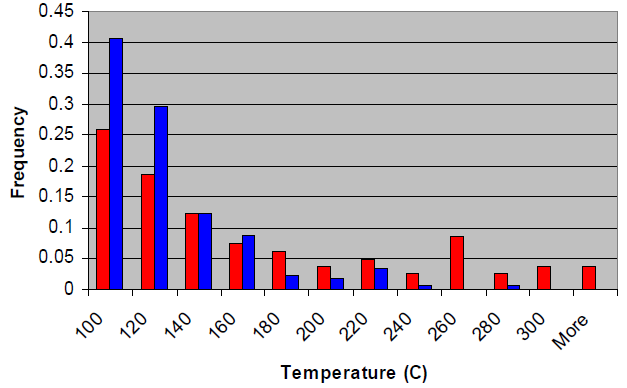
About 70% of known geothermal reservoirs are below the 150C
temperature limit for conventional logging tools; most are below the
260C limit for hostile environment tools. (red = magmatic, blue =
non-magmatic reservoirs).
The Geysers geothermal system in California reaches 656F (346C). (USGS
image)
geothermal ENERGY
IN CANADA AND USA
The largest
conventional geothermal power resources in Canada are
located in British Columbia, Yukon, and Alberta. These
regions also contain potential for Enhanced Geothermal
Systems. The most advanced project exists as a test
geothermal site in the Meager Mountain-Pebble
Creek area of British Columbia, where some exploration wells reached 240 -
260C at depths between 400 to 800 meters. Other wells had
much lower temperatures. Three directional
wells were then drilled in the hotter areas. Each well was
estimated to be capable of producing 4 to 9 MWe, but there
has been no attempt at commercial production.
In 2021, two medium-temperature pilot projects were
announced,
one in northwest Alberta, the other in southeast
Saskatchewan.
Both would be binary systems using 110 C (+/-) source water
in sedimentary rocks. To date (2022) there is no commercial
geothermal electricity in Canada.
A good reference for the Canadian scene is "Review of
National Geothermal Energy Program Phase 2 – Geothermal
Potential of the Cordillera", by A. Jessop, 2008, GSC Open
File 5906.
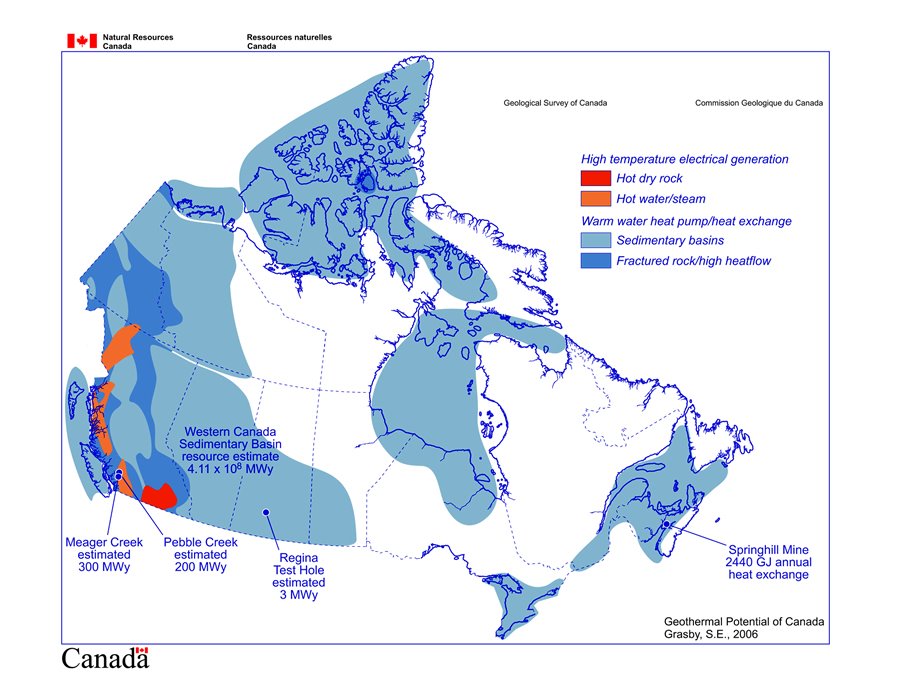
Geothermal map of Canada. Red colours show areas where hot
water or hot rock reservoirs may be present. Blue indicates
warm water possibilities. (GSC image)
 In the USA, geothermal power
plants are currently operating in six states: Alaska, California,
Hawaii, Idaho, Nevada, and Utah. The electric power generation
potential from identified geothermal systems is 9.0 Gigawatts-electric
(GWe), distributed over 13 states. In the USA, geothermal power
plants are currently operating in six states: Alaska, California,
Hawaii, Idaho, Nevada, and Utah. The electric power generation
potential from identified geothermal systems is 9.0 Gigawatts-electric
(GWe), distributed over 13 states.
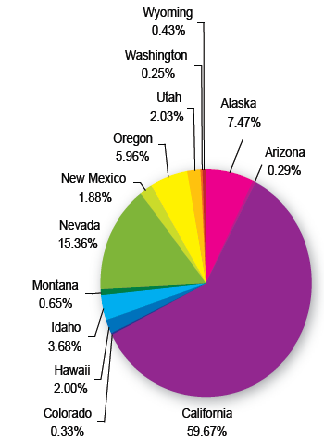
US states that produce
geothermal energy (USGS image) 
This is about 25% of USA's
renewable energy (2008) but less than 1% of all electricity demand
in the USA. Only 2.5 GWe have been developed and are on-line.
Slightly dated information for USA
can be found on the USGS Geothermal Energy website.
California has more than half of
the US geothermal production due to proximity to both sources and
customers. Many good sources in the world are not close to
electricity demand or power grid infrastructure, so are not economic
today.
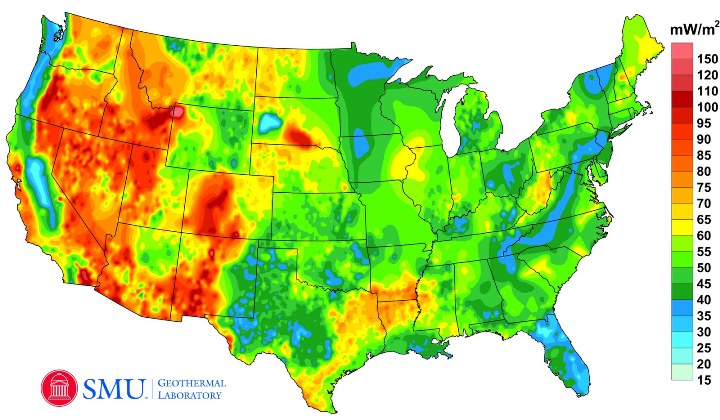
Geothermal energy map for USA. (SMU image)
LOG ANALYSIS IN geothermal WELLS
 Well logging to assess
reservoir properties of geothermal prospects is possible in
most cases. Lithology, porosity,
permeability, fracture intensity, temperature, borehole shape and stability, stress regime, and elastic moduli are typical results that can be calculated from well
logs, time lapse temperature logs are
used to estimate stabilized geothermal well temperature.
Casing and cement integrity logs ensure safe and permanent
well completions. Well logging to assess
reservoir properties of geothermal prospects is possible in
most cases. Lithology, porosity,
permeability, fracture intensity, temperature, borehole shape and stability, stress regime, and elastic moduli are typical results that can be calculated from well
logs, time lapse temperature logs are
used to estimate stabilized geothermal well temperature.
Casing and cement integrity logs ensure safe and permanent
well completions.
Resistivity image log in a
fractured granite, with
true dip and direction on right side of the log
Standard oilfield logging
tools can survive 300F (150C) for short periods and hostile
environment logging tools are good to 500F (260C).
Such tools have been available since 1981 (but the USGS
website about logging geothermal wells seems to be unaware
of this). Resistivity and porosity logs are available for
the high temperature range, but some specialty logs, such as
acoustic and resistivity imaging, may not reach 500F yet.
Technology is always on the move, so check with service
companies for current availability. Purpose-built tools have also been used and
logs of these may be found
in project files.
There are numerous problems
associated with petrophysical analysis of logs for any
purpose, and geothermal wells are no exception. Poor
borehole condition, high temperature, and unusual lithology
are well known issues, even in the oil and gas industry.
Unfortunately, a DOE report written in 1979, based on the
logging technology of the early 1970's, is still widely
distributed and still believed even by USGS professionals.
See "Geothermal Well Log Interpretation Midterm Report"
by S. K. Sanyal, L. E. Wells, R. E. Bickham, 1979,
LA-7693-MS Informal Report UC-66e. Sadly, the SPWLA
Geothermal Log Interpretation Handbook dates from 1982 so it
too is not much help to 21st century petrophysicists.
Most 1970's era complaints
have long been resolved over the 45 years since the logs
reported upon were run. Modern computer software, digital
logging tools, new understanding of multi-mineral models,
better knowledge of tool responses, realistic estimates of
measurement accuracy, higher temperature and pressure
ratings, statistically based calibration to ground truth,
and 45 years of published works from 1000's of practitioners
have solved a lot of the uncertainty concerns.
To perform a competent
petrophysical analysis in a geothermal well, as for any
well, we need a good set of digitized well logs, sample
descriptions, core data (if any), and some basic well
location and directional information. We can then use the
standard deterministic or probabilistic models described in
other Chapters of this Handbook. Review the Chapters on
tight oil, tight gas, fractured reservoirs, igneous and
metamorphic reservoirs, and lithology models.
The minimum log suite would
include resistivity, shear and compressional sonic, neutron,
density, photo-electric, spectral gamma ray, acoustic and/or
resistivity image logs, where temperature limitations can be
met. A temperature profile and some time lapse bottom hole
temperatures are essential. If the well can flow,
spinner surveys can be run to assess flow rates.
Deliverables expected are
rock mineralogy, porosity, water resistivity, matrix
permeability, fracture
intensity, fracture aperture, fracture porosity, fracture
orientation and dip angle, and rock mechanical properties,
such as shear and bulk modulus, Young's modulus, Poisson's
ratio, and Biot's constant. Since logs respond only to
minerals, the initial log analysis model will generate the
mineral composition of igneous rocks (eg. quartz, feldspar,
mica, etc and not generic rock types such as granite or
diorite). If needed, the minerals can be composed into rock
types for comparison to sample descriptions.
Once mineralogy, porosity, and temperature are known, rock
properties pertinent to the geothermal industry can be
derived. Thermal conductivity, specific heat capacity,
volumetric heat capacity, isobaric enthalpy change, and
diffusivity are derived from empirical curve fits to
measured rock property data published in the literature.
From these results and the reservoir volume, a complete
assessment of its potential as an economic energy source can
be made. These calculations are best performed by experts in
geothermal energy and are probably beyond the scope of
petrophysical practice.
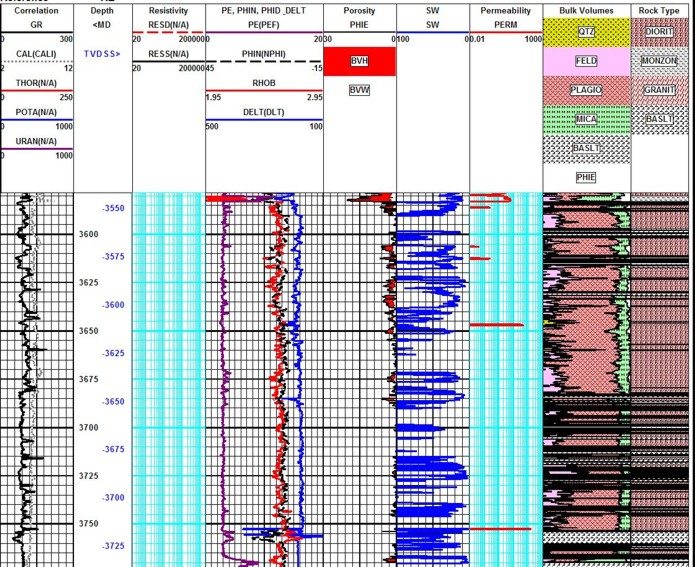
Fractured granite example: raw data curves in
Tracks 1, 2, and 3 with effective porosity, water saturation, and
matrix permeability in Tracks 4, 5, and 6. The mineral model
calculated from the log analysis is in Track 7 and the rock type
model calculated from the minerals using a ternary diagram is in
Track 8. Basalt was triggered from high density or high PE or both.
This is an oilfield example in a deep, hot pluton.
Fracture frequency, aperture, and porosity log in a
fractured granite reservoir derived from
a resistivity image log. The most accurate method is based on
the measured resistivity curves on the image log. The pixel count method is much less accurate
because of borehole erosion and breakouts.
LOGGING EXAMPLES IN
geothermal WELLS
These
examples are taken from the petrophysical literature, some date back
to the early 1980's and may not represent the full capability of
today's technology.
EXAMPLE 1:
Temperature Logs From Meager Mountain, BC
From: "Review of National
Geothermal Energy Program Phase 2 – Geothermal Potential of the
Cordillera", by A. Jessop, 2008, GSC Open
File 5906.
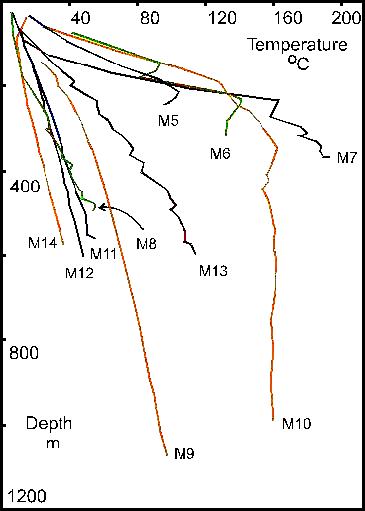
Temperature logs from a Canadian geothermal prospect in the Rocky
Mountains of BC. (GSC image)"
EXAMPLE 2: Fracture identification at Coso, CA
From "Comparison Of Acoustic And Electrical Image
Logs From The Coso Geothermal Field, Ca" by Nicholas C. Davatzes and
Steve Hickman, USGS, 2005.
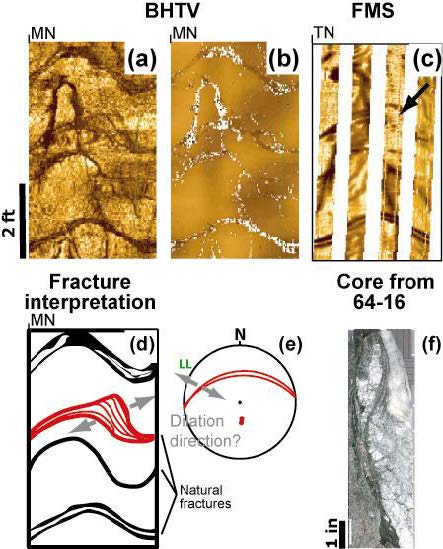
Comparison of acoustic image log and resistivity image log in a
geothermal well.
(a) BHTV amplitude image, (b) BHTV travel time image, (c) FMS
resistivity image,
(d) sketch of fractures, (e) fracture orientation, (f) core image.
Dark colours are fractures or borehole breakouts, light colours are
unaltered rock.
Direction scale at top of each log is N - E - S - W - N.
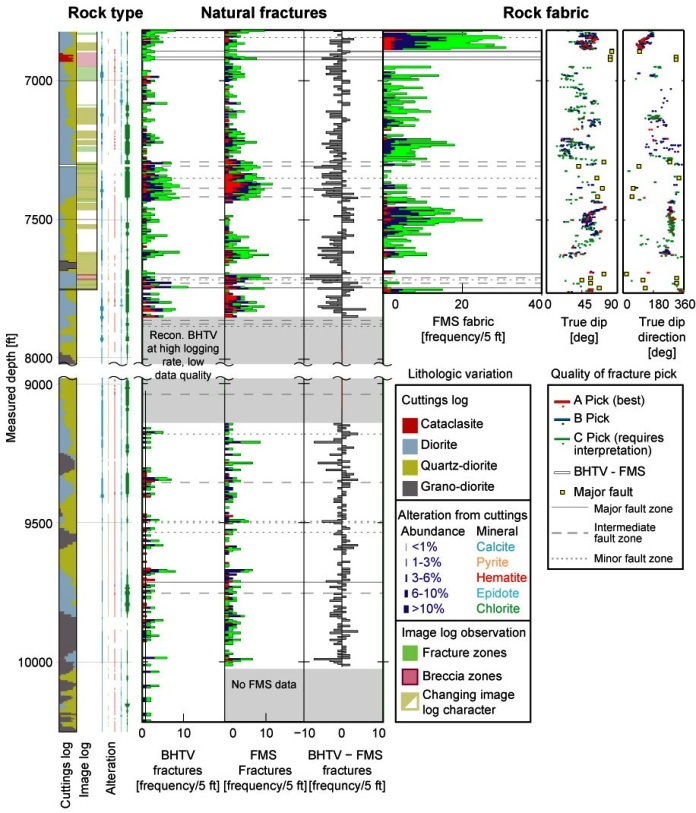
Synthetic and processed logs based on BHTV and FMS logs to quantify
fracture intensity in a
geothermal reservoir.
EXAMPLE 3: Spinner Survey, Geysers Field, CA
From: "Well Logging In Hostile
Environments - A Status Report", by E. Frost and W. H. Fertl,
CWLS, 1985
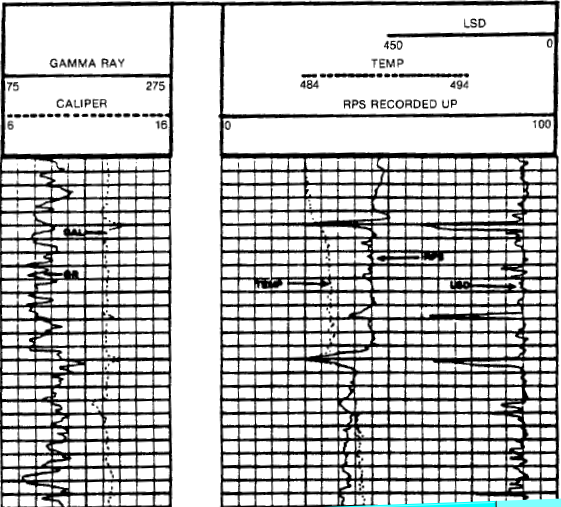
Gamma ray, caliper, spinner, temperature, and long
spaced density (full bore, counts per second) logs in a Geysers well
in California, 1985. Temperature is above 485F.
REFERENCES
As noted in captions to illustrations
|