Petrophysical Training
Licenses
|
 HELIUM and INERT GAS BASICS
The inert, or
noble, gases comprise
helium, neon, argon, krypton, xenon, and radon,
of which helium is probably the most important.
They
are formed during the natural
radioactive decay of elements such as uranium and thorium
within the interior of the Earth.
Helium is a valuable inert gas used in
commercial, military, and medical applications. It doesn't
burn or combine chemically with other elements.
It has
unusual cryogenic properties and is used in welding to cool
material adjacent to the weld and to cool the magnets in MRI
machines, as well as the magnets at CERN that helped
discover the Higgs boson. It also fills kids' balloons,
weather balloons, dirigibles, makes your voice
go squeaky when you breathe it, and helps space ships get
off the ground.
Helium and other
inert gases are often found
in conjunction with carbon dioxide and nitrogen, in wells that were originally drilled for
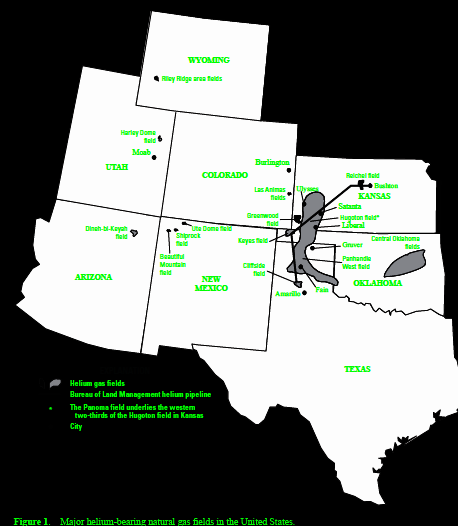
oil or natural gas as early as 1903 (in Kansas). This
discovery led to development, by the US government, of
a large helium resource stretching from Kansas through
Oklahoma into the panhandle of Texas. Pipelines, separation
facilities, and a large strategic reserve storage facility
were built during the 1950's and 1960's. Some processing was
privatized in the 1960's and private development was
permitted from the 1990's. Canada and Poland produced small
quantities in the 1960's and 1970's.
<==
Map of US helium reservoirs in mid-continent region. Image
courtesy US BLM.
Today, the USA produces about 55% of World supply, Algeria
and Qatar about 40%, the balance from a half dozen other
countries. The price is a little volatile, averaging US$
100+/- per thousand cubic feet (mcf), compared to natural
gas at US$ 4.00+/-.
Gas analysis reports
from helium bearing wells show high concentrations of CO2
or N2 with traces to several percent helium. Some have
hydrocarbon gases (methane, ethane, propane) in quantities
too small to allow the gas mixture to burn. A typical
analysis might show 5% He and 95% N2, or 5% He with 95% CO2,
or 5% He, 35% methane, with 60% N2. Wells with less than
0.5% He are probably uneconomic; an average producing well
in the USA has about 4% He.
The method used to separate helium
from a gas mixture is fractional distillation to
create crude helium, followed by low temperature liquefaction
to produce Grade-A 99.995% pure helium.
The major source of helium is
radioactive decay of uranium and thorium in basement rocks
or shales below potential reservoirs. Many helium producing
fields are associated with volcanic intrusions or deep-seated basement shears. Some helium may also come from
the primordial lithosphere through faults; this is the
lighter isotope of helium. Few isotope ratios have ever been
performed so the source is not precisely known in many
cases.
To trap helium in a reservoir
you need the same geological setting as for natural gas:
source rock, migration path, porous reservoir rock,
structural or stratigraphic trap, and a seal at the top of
the trap.
Migration path is usually
through faults or fractures but could be direct contact of a
reservoir with a source rock. Reservoirs are usually
sedimentary strata, but some igneous rocks may be porous and
permeable enough to hold helium.
Traps are often structural,
as drape over domes or anticlines. Strat traps are harder to
seal. The seal is more critical than for conventional oil or
gas. The helium molecule is about half the size of a methane
molecule so it can penetrate through smaller pores and
fractures than methane. This makes it difficult to contain
in samples and the seal on any trap must be lower
permeability than a similar trap for oil or natural gas. The
best seals are salt, salt plugged porosity, lava flows, or
very fine claystone (shale).
Production rates vary with reservoir quality, thickness, and
pressure. Many were overpressured and blew out in the early
days of helium exploration. CAUTION: If you find production
rates or production rate graphs, be sure to distinguish
between total flow rate of all gases versus helium flow
rates -- it isn't always clear.
If you are concerned about the environment, the inert gases,
other than helium, are vented to the atmosphere, including
CO2
and any hydrocarbons in the mixture. A few wells are
actually completed to capture CO2 or N2 for commercial
purposes, but most are not.
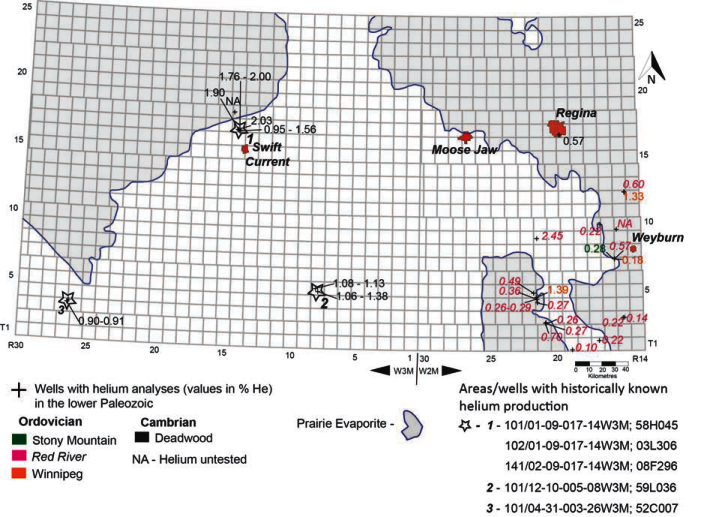
Distribution of all known helium tests in the lower
Paleozoic: Deadwood, Winnipeg, Red River and Stony Mountain
formations. Image from "Helium in Southwestern Saskatchewan", Melinda
Yurkowski, Saskatchewan Geological Survey, Open File Report
2016-1
LOG ANALYSIS IN HELIUM WELLS
Petrophysical analysis of inert gas reservoirs involves the
same steps as any other gas well: shale volume, effective
porosity, lithology, water saturation, permeability,
gas-in-place. There are a number of pitfalls in analyzing the well logs in
helium bearing zone in addition to the usual problems of
rough hole condition, highly variable mineralogy, salt
plugged porosity, and varying water resistivity which can
occur in any well. Here are the critical things that need to
be considered:
1. Old wells have minimum log suites (Electrical survey (ES),
possibly a microlog (MLC). By 1960 there may be a single
transmitter sonic log, by 1965 possibly a density log, and if
the God's are willing, a gamma ray and neutron log (GRN), probably
through casing. Each of these logs require special handling,
covered elsewhere in this Handbook, BUT ALSO subject to all
the concerns listed below.
2. All porosity models must be corrected for shale volume.
The gamma ray may permit this, but it should be calibrated
to XRD clay volume on at least a few samples.
3. Inert gases have no hydrogen, so in theory the neutron log reads zero
porosity. In air-drilled holes, there is no
mud-filtrate invasion, so neutron reads near zero. On
liquid-filled holes, neutron varies somewhat with the actual
water saturation in the invaded zone and depth of investigation
of the log. Clay volume, and
whether or not the gas column contains hydrocarbon gas in
addition to
the inert gases will increase neutron porosity In some wells, invasion is
deep enough for the neutron log to read a reasonable
porosity value. In other wells, the neutron log reads zero
or even slightly negative apparent porosity.
4. Sonic and density logs when transformed to porosity will read too high
a porosity due to gas effect, unless invasion is very deep
and residual gas in the invaded zone is negligible
(unlikely). Standard gas correction models will be needed,
calibrated to core porosity. Variations in matrix rock properties
will need to be controlled by sample and core description.
5. With the neutron log reading too low compared to a hydrocarbon gas
(possibly near zero), the standard gas corrected
density neutron complex lithology model for porosity may not
work well, giving a porosity that is too low. Some limited
experience in Saskatchewan suggests that invasion may be
sufficient to minimize this problem, but there was no core
data available to prove this. In other project areas, the
neutron reads zero and cannot be used as a porosity
indicator.
6. NMR porosity is unaffected by clay, mineralogy, or gas effects, so it
will give a reliable porosity in inert gas reservoir,
provided the borehole is not too rough and there is some
drilling fluid invasion. Some core analysis
control is comforting but less essential than for sonic and
density porosity.
7. The only lithology model that works properly in a gas reservoir is the
PE 2-mineral model. The PE curve was not common until the
1990's and may be missing in many wells drilled after that
date, so there may be no direct method to calculate
mineralogy. Sample and core descriptions are a necessity to assist
in understanding the mineralogy and the higher quality
reservoir faces.
8. After a porosity algorithm has been calibrated to core, the deep
resistivity can be used to calculate water saturation,
provided the correct RW regime can be identified. This
allows the calculation of total gas in place. Multiply by
helium fraction to obtain helium in place.
9. If salt plugging is present, it might be possible to identify it by
very high resistivity and very low neutron and/or NMR porosity. The
efficacy will depend on whether or not the drilling fluid
has dissolved the salt in the zone investigated by the
neutron log. Sonic and density porosity may be lower than
non-plugged intervals due to the different log response of
salt and gas. Results may still be ambiguous. When identified, salt plugged zones are flagged and porosity set
to zero.
10. Once porosity and saturation are calculated, and salt plugged
intervals are flagged, permeability can be calculated from
the usual Wyllie, Timur, or Lucia methods. An estimate of
total gas deliverability at initial unstimulated conditions
is possible based on the sum of permeability thickness
values. There is a large possible error in this result as
natural fracture permeability is not included.
11. Helium concentration
CANNOT be calculated directly from any well log result.
12.
Inert gas wells are among the most difficult to quantify
using well log data. Core analysis data and sample
descriptions, with a little help from XRD mineralogy data,
can make the job a little more
conclusive. Commercial software will most likely fail to give an accurate
estimate of porosity unless you add some user-defined
equations to account for the peculiar gas effect
caused by inert gases..
LOGging program for inert gas wells
While we are stuck with the log suite in existing wells, we
can run an appropriate program today that will give optimum
results. The recommended suite is:
1. array induction or array laterolog with SP and gamma ray. (In
air-drilled holes, laterolog cannot be run).
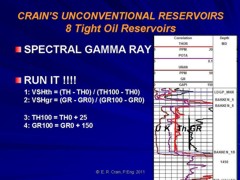
2. density neutron with PE and spectral gamma ray.
3. nuclear magnetic resonance log with gamma ray.
4. array sonic log for correlation with older wells and to assist seismic
interpretation.
5. resistivity image log to assist in facies description, and trap
and seal definition.
Items 3 and 5 are needed only from TD to 100 meters above
the zone of interest.
Gas log, conventional or drilled sidewall cores, close
spaced sample description, and XRD mineralogy and bulk clay
are strongly recommended.
LOG ANALYSIS EXAMPLES IN HELIUM WELLS
ANCIENT LOG EXAMPLES WITH NO QUANTITATIVE PETROPHYSICAL
ANALYSIS
These two examples are from "Oil and Gas; and Helium
Production Potential of Oil and Gas Assets in Navajo County,
Arizona" by Olufela Olukoga, prepared for Blackstone
Exploration Company Inc.
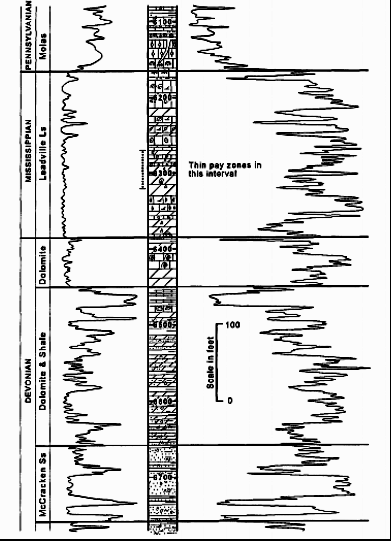
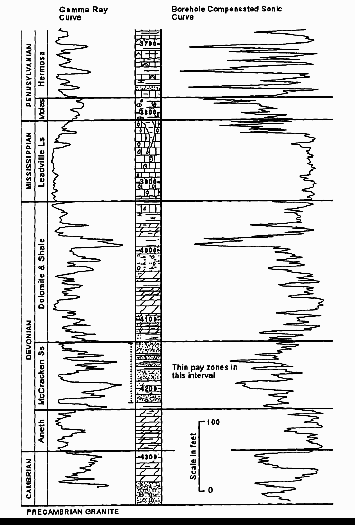
Left: Ancient gamma ray neutron log in
helium bearing reservoir in the Tohache Wash Field. Gas in
the Mississippian was 6.03% helium. Cumulative production
was 385 Bcf total gas. Neutron deflections to the right are
low porosity OR inert gas. Right: Borehole compensated sonic
log in Kerr-McGee #2 Navajo-C well showing the stratigraphic
position of the helium-bearing reservoir in the Dineh bi
Keyah Field. Gas in the Devonian ranges from 3.11% to 6.23%
helium and averages 4.83% helium and produced 1.4 Bcf total. High sonic travel time is high porosity or shale.
MODERN PETROPHYSICAL
ANALYSIS EXAMPLES
These examples are from wells that have tested or produced inert gas with helium in economic quantities.
The analyses were performed for North American Helium Ltd
and are reproduced here with their permission.
EXAMPLE 1: Air-drilled Inert Gas Well
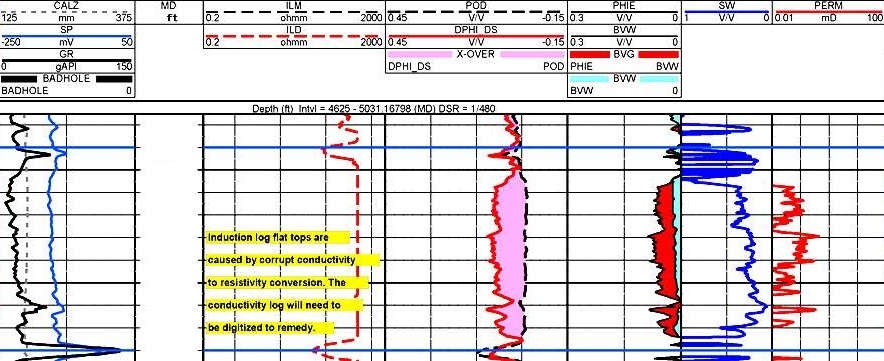
Left hand tracks contain gamma ray, deep resistivity, density, neutron
(with gas crossover shaded pink) curves. Right hand tracks
show calculated effective porosity (with inert gas volume
shaded red), water saturation, and permeability, Neutron log
reads zero porosity since inert gas has no hydrogen content
and there is no invasion from a liquid borehole fluid. SP,
shallow resistivity, and sonic are missing as they cannot be
recorded in an air-drilled hole.(Image courtesy NA Hrliun).
EXAMPLE 2: Liquid-filled Borehole
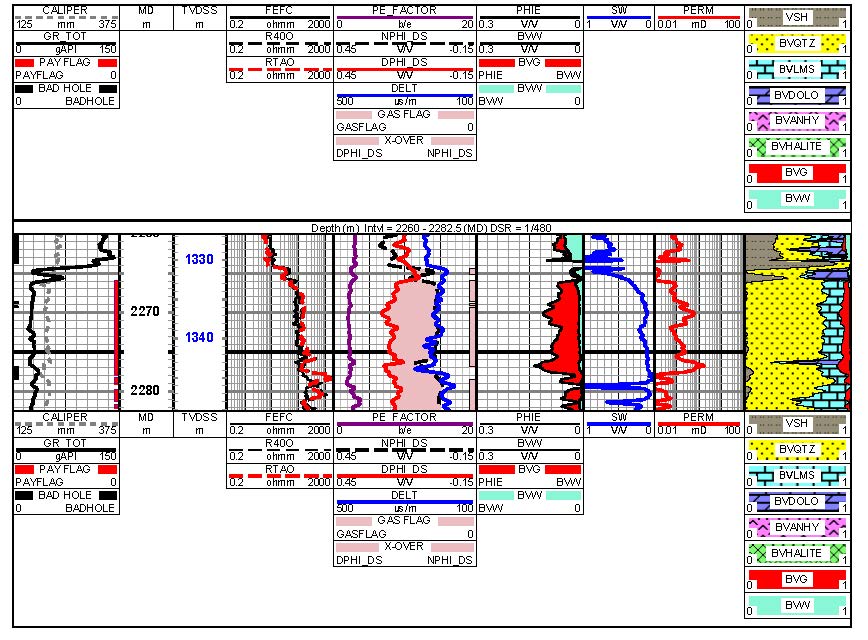
Left hand tracks contain gamma ray, deep and shallow
resistivity, density, neutron (with gas crossover shaded
pink), PE, and sonic curves. Neutron log responds to
invasion water but may read a bit low due to residual inert
gas in the invaded zone. Right
hand tracks show calculated effective porosity (with inert
gas volume shaded red, water saturation, permeability, and lithology analysis.
(Image courtesy NA Hrliun).
|
|