|
 Classic Dipmeter Patterns For Stratigraphy
There are numerous sets of classic dipmeter patterns published
by the service companies. The set from Western Atlas is included
here, with captions, to assist you in learning to analyze patterns,
especially those for which there is more than one interpretation.
They were chosen over others because they include an SP or GR
curve shape and a lithologic cross section on the same drawing
as the dipmeter data for each example.
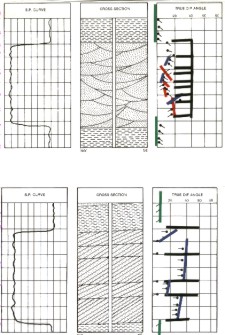
  Arrow Plot - Disconformity and Angular Unconformity Arrow Plot - Disconformity and Angular Unconformity
Disconformity:
This erosional surface will not be indicated by a dipmeter because
the dip direction and magnitude do not change.
Angular
unconformities show up on a dipmeter as a marked change in dip
angle. The dip direction will probably change in addition.
 Arrow Plot - Angular Unconformity and Drape Over Salt Dome Arrow Plot - Angular Unconformity and Drape Over Salt Dome

Angular
unconformity that may be the result of folding of the formations
before erosion. Similar patterns can be produced by slumping of
beds below an unconformity.
Salt
dome, a structural feature often found in the Gulf Coast area,
causes formations to bend appreciably. These forces compact and
often rupture the formations involved. The dip pattern can be
in a constant direction with high dip angles. The dip direction
will normally be away from the center of the dome and will occasionally
reflect a side profile of the dome.
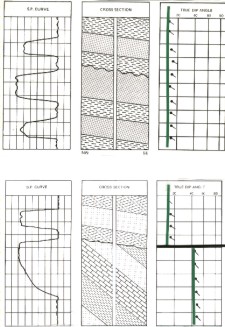
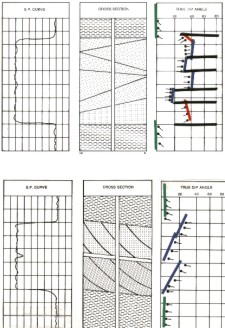
 Arrow Plot - Festoon or Lenticular Cross-bedding and Tabular
or Planar Cross-bedding Arrow Plot - Festoon or Lenticular Cross-bedding and Tabular
or Planar Cross-bedding
Lenticular
cross-bedding, erratic dips occurring in definite sets. These
are the dips commonly referred to as cross-bedding in sands where
the dips are in all directions. The angle can be up to 30 degrees
above the structural dip impressed on the adjacent formations.
This difference is algebraic and dips can vary from above regional
to below regional, depending upon which direction the beds have
been tilted subsequent to deposition.
Tabular
planar cross-bedding, most sets dip in the same direction but
at different angles. Each set of cross-beds has a consistent angle
and direction. Individual cross-bed sets can range in thickness
to a hundred feet or more depending upon the environment of deposition.
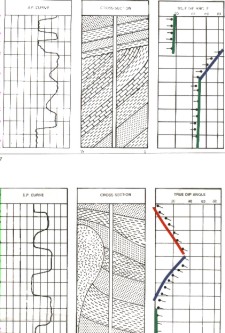
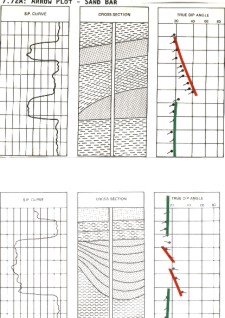
 Arrow Plot - Nonparallel Cross-bedding and Foreset Cross-bedding Arrow Plot - Nonparallel Cross-bedding and Foreset Cross-bedding
Wedge-shaped
cross-bedding sets characteristic of aeolian deposits. Patterns
of markedly different directions with good correlation and several
arrows in each group; this is probably reflect wind deposition.
Foreset
bedding found frequently in deltaic deposits. The arrows indicate
the direction the current was flowing at the time of deposition
if the structural dip of the region is subtracted from the dips
recorded. The minimum dips at the base of each sequence frequently
reflect the structural dip of the area as these were nearly horizontal
at the time of deposition.
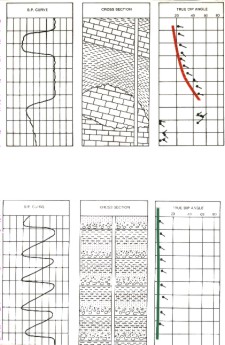
 Arrow Plot - Sand Bar and Drape Inside Channel Sand Arrow Plot - Sand Bar and Drape Inside Channel Sand
A
sand bar can often be detected on the dipmeter if the well is
drilled where the borehole passes through the steep side of the
sand bar. The dip increases rapidly to the top of the bed boundary,
then gradually decreases through the upper beds until structural
dip is again evident. This pattern of increased dip with depth
and then a return to the normal trend is also characteristic of
a normal fault. Here again, the need for some lithology definition
is important.
The
channel sand shown is an ideal type and many channels are not
easily interpreted from a dipmeter. Many channel sand sequences
do not exhibit the increase of dip as the bottom of the channel
is approached. This increase of dip with depth as the bottom of
a channel is approached probably occurs only a small percentage
of the time. Many thick sequences of fluvial (water deposited)
sands show no indication of this phenomenon. Many people have
become disenchanted with the use of the dipmeter for interpreting
stratigraphic traps because its use in channel sands has been
considerably oversimplified. In deltaic sequence, the "classical"
pattern is frequently found, but many other channels are not interpretable
in any simple way from the dip log.
 Arrow Plot - Drape Over Reef and Deep Water Turbidite Arrow Plot - Drape Over Reef and Deep Water Turbidite
Carbonate
reef interpretation from a diplog is fairly straightforward for
reef facies, but becomes rather complex in back reef facies. Under
favorable conditions, a reef will grow upward until its organisms
die due to some extreme change in environment. The reef may then
be enveloped by deposits of mud. The effect of overburden and
compaction will shape this new shale around the reef. The shale
will reflect a pronounced change on the flanks of the reef and
the shale above will reflect a lesser, but distinct amount of
dip. When the reef itself is encountered the dip pattern will
usually be scattered and exhibit increased dip angles. These are
usually measurement of vugs, fractures, joints, etc., and should
not be interpreted as a structural picture of the reef.
Graded-bedding
is frequently found in beds deposited by turbidity currents. These
beds are originally deposited nearly parallel with pre-existing
surfaces, but may have large dips impressed upon them by orogenic
movement which has taken place after deposition. The SP may not
indicate the cyclic repetition if clay minerals are not more abundant
in the finer grain segments of the turbidites.
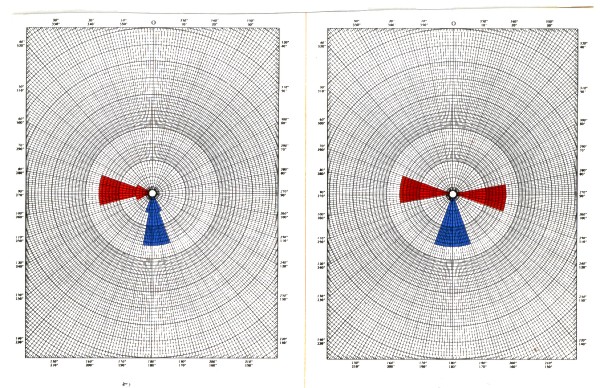
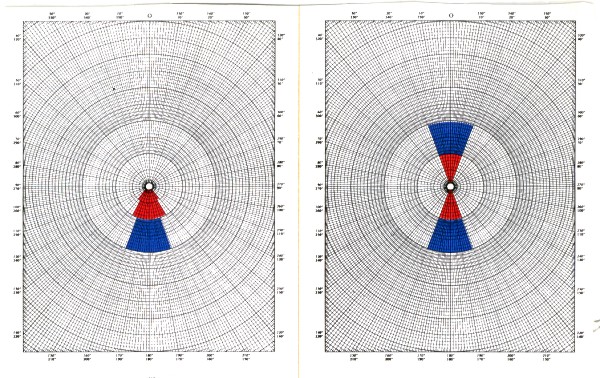
Pattern Azimuth Frequency Plot - Stream Channel
Off Center and Centered
Bimodal
distribution of red and blue patterns indicates probable deposition
in a stream channel to the East of the channel trough. The current
flow is to the South.
Trimodal
distribution of patterns. This pattern indicates probable deposition
in a stream channel near the trough and with the current within
the channel flowing to the South.
Pattern Azimuth Frequency Plot - Barrier Bar
or Delta Front and Barrier Bar or Tidal Channel
Unimodal
distribution of red and blue patterns. Usually associated with
barrier bar and other shoreline sediments where primary action
is perpendicular to the trend of the sand body. The angles can
be more dispersed if the waves hit at angles other than perpendicular
or if longshore currents influence deposition to any extent. Bar
trends from East to West and thins to the South.
Bimodal
distribution of dip patterns probably indicating a well drilled
through the crest of a barrier bar type deposit.
|