Controversy still rages over the best water saturation method and the ultimate water saturation equation has yet to be presented. Water saturation analysis in shaly sands and porosity determination were both being studied in the late sixties. With several independent sources of data, and with more unknowns than measurements, a new style of analysis was proposed. Instead of solving a fixed set of simultaneous equations, various iterative solutions were used to minimize the change in one or several computed results. The primary goal was to correct for shale, light hydrocarbon effect, heavy mineral effect, and to solve for porosity and lithology at the same time. Success depended greatly on log data quality and on how well the calculation model actually fit the real geology. Much work is still being done in this area and new approaches appear in journals yearly.
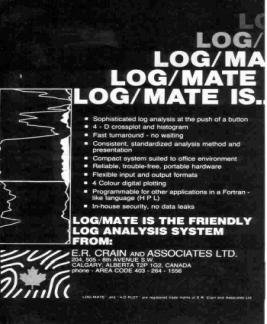
These models absolutely depended on high powered computers, digital data recording (first achieved in l965) and great patience, since results did not appear quickly. Weeks or months might be needed to get results for even a small group of related wells. This situation has improved markedly since 1985. More advanced computer programs for carbonate rocks appeared in l97l to provide a similar service as was available for the shaly sand situation. The goal in this program was automatic hydrocarbon correction and mineral identification. The best known examples of these programs are Schlumberger's SARABAND (superceded by VOLAN and ELAN), CORIBAND, and Dresser Atlas' EPILOG products. All these methods are iterative refinements of the crossplot or simultaneous equation solutions. During the seventies and early eighties, these methods were programmed on low cost sophisticated hand calculators. If large volumes of data were required, desktop computers with digitizers, plotters and printers could be obtained from several sources. Today, the ubiquitous personal computer does the work at a fraction of the cost and time. The first truly portable stand-alone desktop system that did not require connection to a large mainframe computer was LOG/MATE, developed by the author and D. W. Curwen in l976. This was 5 years before IBM "invented" the PC. It has since been mimicked and improved upon by many others, so that a wide range of such systems are available.
Timeshare systems using computer terminals to larger mainframes or mini-computers were first seen in l965, and are still used. Both batch and interactive time share systems can be found in many oil companies, service companies, and consulting firms. The phrase "time sharing" has disappeared from computer lingo but the concept persists with local area networks, UNIX servers, and distributed computing. Log analysis methods vary from crude to complex and the quality of results varies with the knowledge and experience of the analyst. The quality and age of input data is always a problem to consider. Simpler systems, with a good analyst at the controls, often provide better results, because of the personal input and knowledge of the analyst. More complex programs tend to do unexpected things and are not easy to control, even by expert log analysts. Moving the analysis from the office to the wellsite, to speed up decision making, has always been a driving force in analysis techniques. Of course, all the manual methods described above could be performed at the wellsite, using charts and slide rules, and later with electronic calculators.
CYBERLOOK Computed Log Analysis c. 1976 A number of new tools, revised uses of older tools, and significant advances in computer processing of log data have been introduced in the 1980's, and are gaining rapid acceptance by well operators. Satellite transmission of log data from the wellsite to service company computer centers superceded the Telecopier and FAX machine in many areas, allowing faster decision making at the head office, somewhat to the detriment of local autonomy and egos. The lithodensity log is an improved density log with reduced statistical variations on the density measurement, and a new curve - the photo electric capture cross-section curve, better known as the PE curve. Its' value depends on the rock lithology and is relatively unaffected by porosity and pore fluid type. Therefore, it can be used to assist in lithology identification in simultaneous equation solutions. The natural gamma ray spectrolog, mentioned earlier, is now also widely used to resolve lithology problems, such as radioactive dolomite or granite wash formations, or to help define clay types in shale. It provides three primary curves - the potassium, thorium and uranium curves, which when summed, give the total gamma ray curve. These three curves, plus the three porosity curves (density, sonic and neutron), and the Pe curve provide seven independent measurements of formation properties, which should allow a total of eight lithologic properties to be calculated from the data. The three usual resistivity curves, the caliper curve(s), and data from the electromagnetic propagation log, which is presently being used to determine flushed zone water saturation, can be added to the list, for a total of 12 or more independent curves. It is clear that the solution mechanism is beyond chartbook and calculator capabilities. Most popular computer programs have been updated to provide specific hard-coded solutions for specific combinations of these tools and individual lithologic models. For example, Dresser lists eight different open hole and five cased hole programs to adapt to the changing times. When one considers adding multiple passes of the thermal decay time log (pulsed neutron log) for each year of a well's life, the data explosion becomes increasingly difficult to cope with. One product, called FACIOLOG, by Schlumberger, was an attempt to reduce this data overload to a minimum. It provides a detailed electro-facies log which, when calibrated to rock sample and core data, can be very useful in understanding depositional environments and well to well correlations. It can also be presented on a seismic time scale to assist in correlating normal seismic data, or vertical seismic profiles taken in the same well. Its’ visual appearance mimics the type of shading used by geologists while drawing their geological sample logs. Unfortunately, such interpretive log displays have not received wide acceptance. Single well studies as described above lead directly to field and pool studies, seismic modeling, mapping, contouring, reservoir modeling and simulations which are topics not normally associated with well log analysis. Such studies are becoming commonplace, and are far more successful when the log data has been properly processed for the specific end-use, and integrated with all other geoscience disciplines. A second approach by Schlumberger has been to create a universal log analysis program, in which the log data suite, the lithologic model, and the log-rock response equations are provided by the user, instead of being hard coded. This product is called GLOBAL and can be classed as a linear programming solution. It has additional features which make it unique, such as a complete set of detailed environmental corrections, and a statistical evaluation section which attempts to minimize the inconsistency between input data sources and assumptions, and the analysis model being used. The uncertainty in each input data value is also considered by the program. This approach is independent of the log analysis model used which could be VOLAN or CORIBAND or any other model supplied by the user. Similar software is available now from several sources. Another area of advance is in dipmeter analysis, as more sophisticated computer programs provide more coherent data for evaluation of detailed stratigraphy and permeability direction. This is especially practical when combined with a product like FACIOLOG. The nuclear magnetic log (sometimes called the unclear magnetic log because so few people understand how it really works) is also being pursued again for its ability to predict permeability, fluid viscosity, clay bound water, and irreducible water saturation. These complex and expensive logging tools plus analysis procedures have one thing in common - the capacity to improve oil and gas production if used properly. In order to reduce dependency on imported oil in Europe, USA, and Canada, it is necessary to exert this maximum effort on many wells. A minimum well evaluation effort is no longer considered a cost saving, but is instead an expensive loss of potential reserves. The
recent years in well logging can be termed the era of digital
data, giving tool designers and analysts the power of the computer
to bring to the surface more data of higher quality than ever
before. |
|
||||||
|
Page Views ---- Since 01 Jan 2015
Copyright 2023 by Accessible Petrophysics Ltd. CPH Logo, "CPH", "CPH Gold Member", "CPH Platinum Member", "Crain's Rules", "Meta/Log", "Computer-Ready-Math", "Petro/Fusion Scripts" are Trademarks of the Author |
|||||||

|
||
| Site Navigation | HISTORY WELL LOGGING 1971 - 1995 | Quick Links |
 In
l963, attempts were made to interpret porosity and water saturation
automatically by recording the so-called moveable oil plot. This
involved analog processing of log curves to obtain the appropriate
data. How many readers actually know what an analog computer is?
In
l963, attempts were made to interpret porosity and water saturation
automatically by recording the so-called moveable oil plot. This
involved analog processing of log curves to obtain the appropriate
data. How many readers actually know what an analog computer is?