|
 IMAGES and INTEGRATION
The perpetual evolution of logging tools to improve data quality,
signal to noise ratio, bed resolution, and depth of investigation
demonstrate the gradual, almost un-noticed, changes in our industry.
This will no doubt continue; but how far can we go, or want to
go, is an open question. We may already record more data than
we can conveniently use. The question really is: Is it the right
data to give the answers we need.
The
introduction of digital image logs and signal processing theory
to log data are dramatic improvements that have fundamentally
altered how we use logs, for example in quantifying fracture porosity
and intensity or in evaluating depositional environment. What
could be the next great leap is not at all clear. We have exhausted
most of the available frequencies of the electromagnetic spectrum
(except maybe the infra-red) and have tested most physical principles.

Abstract, in Arabic, of this articlaw as
published in Libya in 2000
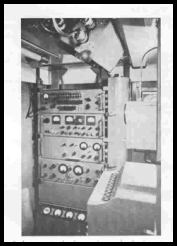
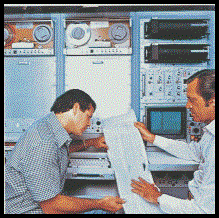
Evolution - Early logging truck, Modern truck (Schlumberger
photos)
We
have come a long way since the Schlumberger brothers put the first
electrical log onto paper in 1927.
The
incredible and unpredictable growth of other technologies outside
our industry also has had dramatic effects. Low-cost high-speed
computers, powerful spreadsheet and graphics software, satellite
data transmission, and group work via local area networks or the
Internet have changed the way we do our work. The massive increase
in data quantity brought about by these technologies threatens
to overwhelm us, since training, corporate infrastructure, and
management style can barely keep up. How much faster can computers
run ever more complicated software with ever larger data sets?
To
give you a sense of the progress in computer-aided log analysis,
I wrote my first program in 1963 on an IBM 1401 computer to solve
mineralogy and ore grade in the potash fields in Saskatchewan.
The computer filled a room the size of a small assembly hall and
the program was about 100 lines long. Later, I programmed a desk-sized
computer (an IBM 1130), then more room sized beasts (EMR 6050
and CDC 3300). In early 1976, I recognized the need to pursue
a small portable solution, and after evaluating several rack mounted
industrial machines, I settled on a desktop calculator/computer,
the HP 9825. This became the first commercial log analysis system
on a desktop - LOG/MATE, five years before IBM “invented”
the PC. By the way, the original HP 9825 had only 4 Kilobytes
of memory and the floppy disc held only 256 K. It cost 10 times
more than today’s 2 GHz machine with 128MB memory and 40GB
hard drive! We have clearly made progress here too.
So,
let's take a look at what is new and developing in our field that
will benefit the oil and gas industry. Three buzzwords summarize
the current state of the art in well log analysis - imaging, resolution,
and integration. Let’s look at these in turn.
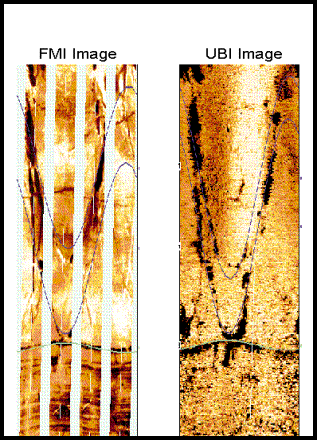
Two
logs provide a more or less complete image of the rock on the
wall of the wellbore. One is the formation micro-scanner or micro-imaging
log, a super-micro, multi-electrode, multi-pad resistivity log,
an offshoot of the dipmeter tool. The log appears similar to a
photograph; low resistivity is shaded a dark colour, high resistivity
is white. The shading between colours is cunningly chosen so that
stratigraphic features can be seen, usually with better resolution
than can be seen with the naked eye on real cores. Fractures and
bedding planes, along with their dip angle and orientation, are
readily identified. Image enhancement software similar to that
used for air photos can be applied to help bring out subtle detail.
This
log also leads in the resolution category; it can visualize fractures
of only a few microns in width. Further numerical processing leads
to quantitative assessment of fracture intensity, fracture aperture,
and fracture porosity. These results emphatically debunk much
“conventional wisdom” regarding fracture aperture
and porosity.
The
second tool that gives a real image log is the acoustic imager,
often called a televiewer log. It uses a rotating head that emits
and receives an acoustic signal. Both sound amplitude and sound
traveltime are recorded, giving images proportional to acoustic
impedance and borehole diameter respectively. Resolution is lower
than the micro-scanner, although most significant bedding events
and fractures can be seen in well consolidated formations. The
log can be enhanced in image processing software.
To
capitalize on the imaging concept, newer versions of the induction
log, laterolog, and sonic log are presented in an image format
as well as the usual wiggly curve format. The resistivity log
image from the azimuthal resistivity log (a form of laterolog)
is a coarser resistivity image similar in appearance to the micro-scanner.
The azimuthal resistivities are very helpful in horizontal wells
as curves looking upward into shale or tight cap rock or downward
into a water zone can be isolated from the horizontally aimed
curves.
The
array induction log presents 5 resistivity curves of 5 different
depths of investigation, as well as a coloured map of these values.
This aids analysis of invasion profiles. The measurement
of vertical resistivity is being field-tested and this will aid
in solving thinly laminated reservoir problems.
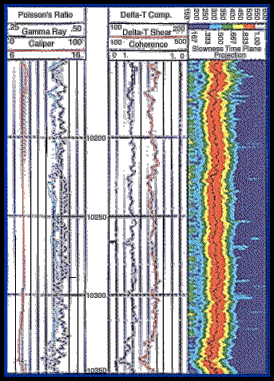
The
array sonic and dipole shear sonic logs offer the usual three
acoustic log curves, recorded at a multiplicity of spacings if
desired, as well as a colour image of acoustic wavetrains. This
allows visualization of the changes in amplitude and arrival time
of the three acoustic waves and emphasizes interference patterns
that indicate fractures.
Where
can image logs go in the future? I hope “everywhere”!
To do this, logging speed will have to increase and costs will
have to drop. An article in Hart’s E&P magazine states
that one-third of the world’s oil is locked up in low-resistivity
laminated shaly sands. The high resolution of the micro-scanner
and televiewer are the only logging tools available to determine
net sand in this environment. Look forward to this revolution
and be prepared to pay the price for logging, processing, and
analysis that comes with the huge data volumes.
 |
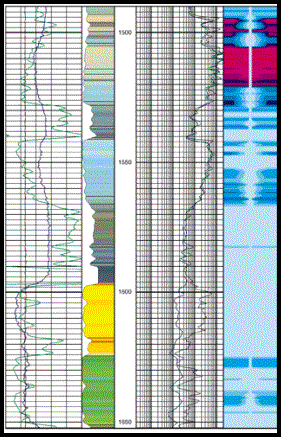 |
Image logs - Microscanner, televiewer, resistivity
(saturation profile) |
The
last three tools described above also qualify in the thin-bed
resolution sweepstakes, as they attempt to resolve beds to about
1/3 the thickness of previous tools. Combined with thin bed processing
of the newer density, neutron, and gamma ray logs, we are now
able to obtain more accurate porosity and water saturation in
beds as thin as one or two feet instead of the more usual three
to six feet. Unfortunately, little can be done for older logs
that already exist in our file cabinets. The thin bed processing
available today requires high density digital recording and this
cannot be extracted from earlier data files or paper logs.
Unfortunately,
high resolution logs look noisy. Many are filtered “to look
nice”, this is a tremendous waste of data. In 1967, I delivered
some of the first deconvolved seismic sections in Canada to a
client. He was horrified because the data looked so noisy. Where
would seismic processing be today without deconvolution? I have
always been amazed at how slow the well logging companies have
been in applying decon to log curves. Now, if we could just get
them to square up the bed boundaries!
 |
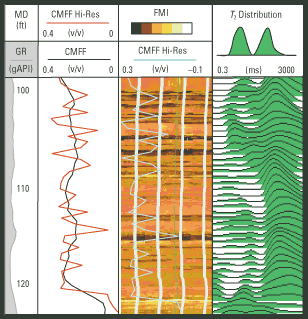 |
High resolution - Sonic wavetrain, microscanner, nuclear
magnetic resonance logs |
High
resolution and imaging logs also require excellent borehole conditions.
Management must ensure that drilling and mud engineers are part
of the team.
These
logs provide more megabytes of data than ever before. Fortunately,
computer speed, memory size, and data storage capacity of modern
desktop computers have kept pace with this development. Hardware
costs are much lower than fifteen years ago. However, log analysis
software costs are higher than ever, partly because the software
does more than it ever did and partly because we demand such attractive
screen and printer images. The larger integrated software packages
are ill-suited for casual users, so there is still a strong need
for small easy-to-use packages. Lower borehole signals, stronger
signal sources, more sensitive receivers, and signal summation
techniques will continue to improve resolution at a steady pace.
Integration
means the cooperation and interchange of ideas, data, and results
between the various geoscience disciplines involved in a pool
study or reservoir simulation. Integration means that all team
members have a common understanding of what the logs and log analysis
indicate. Feedback between each group forces iteration and refinement
of all results.
I
am still asked to review projects where the log analysis has not
been compared to core analysis, well performance, or sample description!
I call this type of review a “Forensic Log Analysis”.
It usually involves an autopsy, or at least major surgery, to
find out what went wrong. Re-computation is inevitable when log
analysis is done in isolation from the other disciplines. There
is no point in performing a “Blind” log analysis;
this is merely data processing, without ground truth control.
As some of you may know, I am legally blind, so maybe that is
why I am so sensitive about this issue.
Integrated
projects require an extraordinary effort in communication between
team participants. Many professionals are not good communicators;
we talk a good line but we don’t listen well. Turf wars,
ego, and seniority must be put aside. Team leaders must be adept
at locating barriers to good communication. Team members must
be willing to give up some independence in order to give and receive
the knowledge needed for a successful project. This is never easy
and I predict that there will still be many reservoir description
failures caused by poor communication, not by lack of data or
lack of effort.
Integrated
exploration, development, and simulation software is readily available.
This helps to share data and results, but does little to help
share understanding unless those good communication skills are
present.
Another
form of integration is also taking place - corporate merger and
acquisition by both logging service companies and oil exploration
companies. The three major well logging service companies now
have most field services (logging, testing, cementing, etc) tied
up under one roof, and have added geophysics, geology, engineering,
simulation, production, and management services and software to
offer one-stop shopping for the resource owner. They are now offering
to run complete oil field operations from discovery, through production,
to field abandonment.

Integration - Project planning and implementation
It
will take a major change on the part of the resource owner to
monitor the performance of such a service. Instead of doing the
work in-house, they will have to check and monitor others and
request changes or improvements in performance. These are roles
that many professionals are not ready for, so training and corporate
infrastructure will have to change dramatically. The changes will
have to be made well before such contracts are given out. Unless
a resource owner is ready for contract development, I predict
some very unhappy scenarios.
Finally,
we should mention the Internet as an integrating as well as a
liberating force. Databases are more easily accessible, results
and reports can be transferred by email, and much work can be
done away from the corporate office environment. Soon, major application
software and technical learning centers will be widely available
on the Net. I currently receive and deliver the vast majority
of my work over the Internet. Although it is always nice to have
face-to-face meetings with clients and co-workers, it is not necessary
to over do it. Many professionals complain that they spend too
much time in meetings. Group work or consulting via the Internet
reduces the need for many meetings.
Electronic
mail beats “telephone tag” and gives a permanent record
of what was really said. I see a great future for remote group
work. The only perceived snags are data security and loss of control
over employees, but these are capable of solution with a little
effort.
There
are other areas of petrophysics where change will certainly occur.
Controversy still rages over the best water saturation method.
The ultimate water saturation equation has yet to be presented.
Maybe some one in this audience will develop the perfect equation.
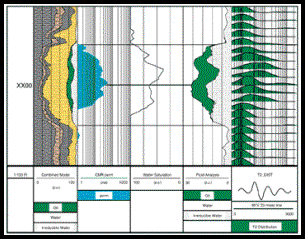
The
nuclear magnetic resonance log dominates the technical papers
submitted at conferences. After 30 years of development, the tool
is just reaching adulthood. Customer resistance to previous hyperbole
will gradually disappear. However, the small rock volume seen
by the tool will continue to make it difficult to integrate this
data with conventional logs. Some people see this tool as a panacea
for all that ails conventional log analysis. This just isn’t
true. For example, a claim is made that the NMR porosities are
independent of lithology, yet the T2 cutoffs that determine porosity
vary with lithology.
 |
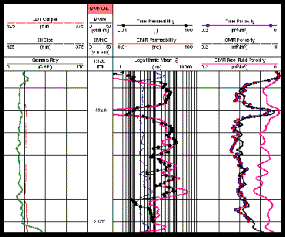 |
NMR pay in high SW environment, NMR porosity and permeability
vs core |
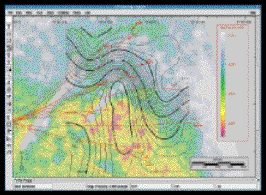
Geostatistics
to predict petrophysical rock properties away from the well bore
is growing in popularity. Good software exists and some successes
have been published. Further integration of geostatistics with
seismic attributes and seismic petrophysics is in its infancy.
Lack of training and expense are the current holdups to more widespread
use.
Seismic
petrophysics, especially with long offset spreads, is on the rise.
Again, 30 years have passed since seismic inversion was first
practical and we are just now getting close to real petrophysical
properties. Again much training is needed, since many practitioners
seem to forget that sonic and density logs see an invaded zone
and the seismic signal does not. How much longer will it take
to learn this simple truth?
 |
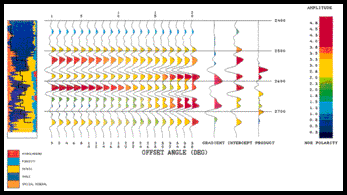 |
Geostatistical porosity distribution map, AVO seismic
model from log analysis |
We
cannot ignore the tremendous strides in Logging While Drilling.
Most conventional open hole measurements can be made near the
bit, before invasion becomes too serious. Even the NMR is in an
LWD test program. More deviated, deeper, hotter holes will require
this technology. Reservoir description is enhanced because of
the immediate acquisition of data and the reduced invasion profile.
Cased
hole logs for reservoir description, completion integrity, and
fluid flow evaluations are much enhanced over previous efforts.
Casing, tubing, and cement image logs are readily available but
seldom used to their full extent in solving well performance problems.
Production logging is underutilized in remedial work. When they
are run, analysis skills are weak, especially in deviated,
multi-phase flow. There seems to be no concerted effort to correct
this lack of training.
With
favorable cement bond, most open hole measurements including sonic,
density, and resistivity, can be measured through casing. The
resistivity log is being field tested by the major logging contractors
as we speak here today. It’s about time- an independent
Canadian company offered such a tool over 25 years ago. Not all
that is new or useful comes from the major research centers; the
“little guy” has an important role to play. NMR and
highly focused induction logs both came from outside our industry
and were pioneered by small independent research labs. Although
I have no idea what the next important advance will be, it is
likely that it will come from an unrelated field.
The
state of the art in log analysis software has advanced significantly.
In deterministic models, we have seen tremendous strides in the
ability to handle user-defined algorithms and user-defined displays
of results. Gone are the days of inflexible, hard-coded math that
doesn’t quite suit the rock sequence. Such systems allow
competent users to experiment with new ideas, add new log curves
as they are invented, and present their own images to management
- all this without re-writing the underlying software. We no longer
have to “lie to the computer” or modify results outside
the program to obtain rational results. These programs also have
enhanced core handling capabilities, as well as annotation and
reporting features, such as sample description and mud/gas log
integration.
The
multi-mineral and probabilistic models available today are more
robust and the underlying tool responses are better known and
more linear. It still takes considerable effort to tune the models
for a particular rock sequence, so they are not a cure-all or
an “automatic” log analysis solution. Other forms
of data reduction, such as principal component, multi-variant,
or least-squares regression analysis are also more practical,
mainly due to faster computers and software packages that are
easier to use.
Integration
of deterministic models and user-defined algorithms with probabalistic
or other hard coded models is not well developed. We are still
forced to run these disparate models in relative isolation from
each other, with the analyst left to iterate between them. By
adding expert system and fuzzy logic concepts, I expect that these
program designs will gradually be merged into a coherent whole.
Software that incorporates neural network code may already be
aimed in this direction. Unfortunately, I have no personal experience
with neural network products, so I can’t vouch for their
success.
There
is much happening in our field. Petrophysics is changing. The
uses of petrophysics are changing. We will never be out of work!
In
the face of continuous change, humans yearn for consistency. We
normally resist change and strive instead for the traditional
approach. Unfortunately, we will never optimize oil production
this way. We must learn to accept the challenge of change, adapt
to it, and in fact, lead the charge by innovation and invention
of new solutions to the problem of data overload, complex reservoirs,
and working with multi-discipline team members.
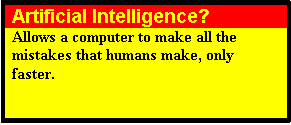
The future? It will probably involve artificial intelligence -
the darling of the academic world in the 1980’s. Computer
based expert systems will learn from experts in the field of log
analysis, and will subsequently advise and consult with less expert
users. As the expert system is increasingly used, its cleverness
will heighten, until it is more intelligent than any single expert.
Such hardware and software already exists, albeit for much simpler
situations than log analysis. However, it is known that major
service companies, oil companies, and consulting firms have embarked
on research in this field, emphasizing log analysis.
The
success of a log analysis is judged by how well the analysis predicts
the future performance of the completed zone. Many analysts and
their managers are unaware whether their results were good or
bad. Artificial intelligence with a learning data base, should
provide the kind of "perfect memory" and the unbiased
question/answer sequence needed to keep track of success and failure.
 Hopefully
we will learn how to do better work as time goes on, by studying
the background to each success or failure, monitored automatically
by the expert system. Hopefully
we will learn how to do better work as time goes on, by studying
the background to each success or failure, monitored automatically
by the expert system.
The
future holds the promise of a long sought goal in well logging
- an automatic, universal analysis program that never fails
and adapts to change. Of course, this is just a dream, right?
Twenty
years have passed since the above was written and neither prediction
seems any closer to fruition. What happened to all that research
effort and all those prototype systems?
|

