|
 SPINNER FLOWMETER BASICS
Flowmeters use an impeller (spinner) driven by the movement
of borehole fluid. The data is recorded as revolutions per
second (rps) which, when properly calibrated, leads to the velocity of fluids in the tubing or
casing in a production or injection well. Knowing the pipe
size, we can calculate flow rate in barrels per day (bopd or
bwpd). A few other details are needed to handle gas rates.
 On a fullbore flowmeter, the spinner assembly folds
into a diameter small enough to fit into the tubing, and
expands to a larger diameter for surveys in the casing below
the tubing. On a fullbore flowmeter, the spinner assembly folds
into a diameter small enough to fit into the tubing, and
expands to a larger diameter for surveys in the casing below
the tubing.
Continuous flowmeters do not fold and are best suited for
surveys in the tubing.
Both continuous and fullbore flowmeters can be logged
downward and upward to create continuous logs. Logging in
both directions at several different logging speeds is a
normal procedure to determine friction effects on the
spinner, giving a method for downhole calibration.
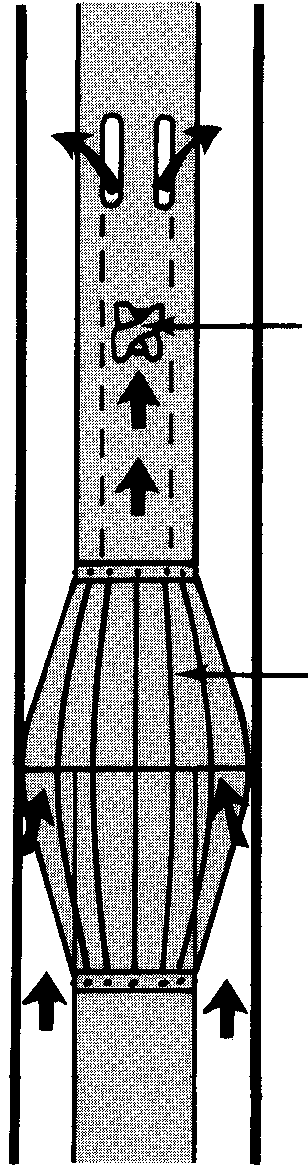
<== Diverting or basket flowmeter
Diverting flowmeters are the most accurate of
the spinner devices in low rate and multi-phase wells. The
flow is diverted through the tool barrel, which raises the
velocity of flow and increases the sensitivity so that they
can detect rates as low as 10 to 15 bpd. Diversion of fluid
into the tool barrel is accomplished by a skirt of fabric or
metal leaves that are deployed to contact the tubing or
casing wall. Often called basket flowmeters, the skirt
exhibits little leakage even below tubing.
Older tools used an inflatable packer to divert all flow
through the tool.
For multi-phase flow, additional tools are
necessary, such as the fluid capacitance or gradiomanometer
log to assess water or gas comingled with oil.
This tool takes its flow measurement while stationary with
the skirt in the open position. It can be pulled up to the
next station without closing the skirt. A log is created by
connecting the data points by straight lines.
A temperature sensor should always be included in the tool
string as it has better vertical resolution than the
spinner, so it can locate small inflows not seen on the
spinner log.
The multi-capacitance flowmeter measures the velocity of
fluid flow in a production or injection well by measuring
the transit time of a disturbance between two dielectric
sensors a fixed distance apart. The device is a type of
crosscorrelation flowmeter that uses several pairs of
capacitance, or dielectric, sensors held on an arm to span
the borehole.
An array
spinner with array capacitance is being developed, which
would be especially helpful in
highly deviated or horizontal wells.
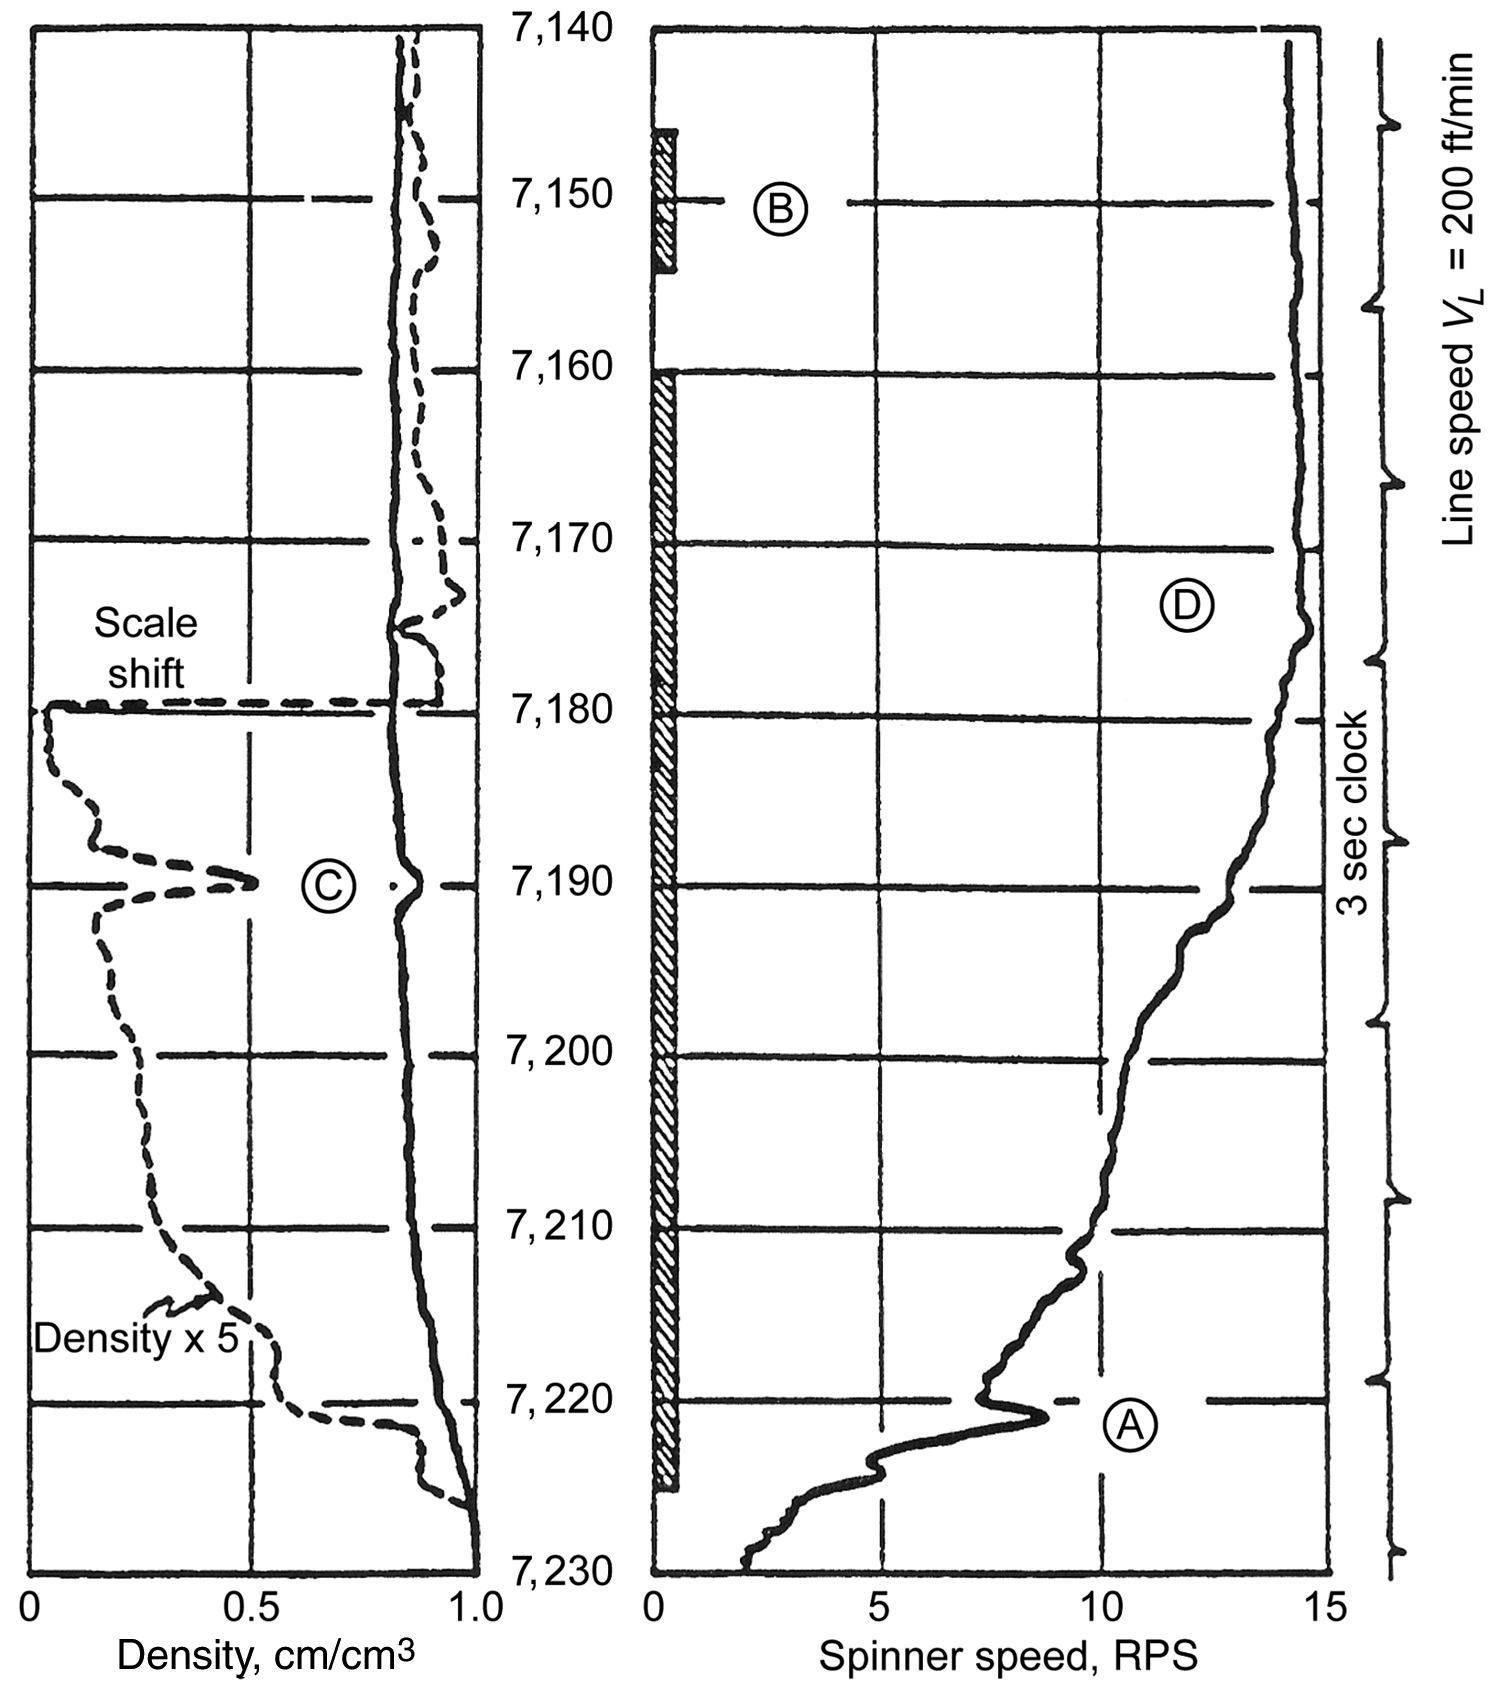
Fluid density (track 1) and spinner survey (tracks 2 and 3).
Well flowing 10,000 bpd. Density shows water density in sump
below perfs, oil density over perf interval. Spinner shows
increasing cumulative production over lower half of perfs.
The upper half of the perfs may have been ineffective or the
reservoir quality is so poor that no flow can be expected. A
competent forensic petrophysical analysis could answer
this question and a workover initiated if warranted.
Amplified fluid density curve shows slight decrease up to
7160 feet indicating some water in the oil below this depth
- this is the "water holdup".
MODERN INTEGRATED PRODUCTION / FLOWMETER LOGS
Numerous service providers have offered flowmeters in
combination with fluid density, temperature, pressure, natural gamma
ray, and tracer logs for many years. In two-phase flow, these logs
are quite adequate in many cases, even in some horizontal wells in
which the flow regime is reasonably well behaved.
However, understanding horizontal flow can be quite challenging and
more sophisticated tools may be helpful. These include all the usual
sensors as well as some new ones, with some arranged in fixed arrays
to show horizontal flow and three-phase flow in considerable detail.
Layered flow often occurs in high angle wells, with a
water layer in the lower part of the wellbore cross-section, an oil
layer above the water, and a gas layer at the upper part of the
cross-section. One objective of the integrated tools is to create an
image of the actual flow regime.
The following tool description is based on
the Schlumberger Floview Plus tool introduced in the mid 1990s. The
description is condensed from PetroWiki and the examples are from
Schlumberger.
There are three key components to the tool. First is a
full-bore spinner. This item gives information about composite fluid
velocity.
The second component is called Floview Plus. The main results from
this tool are eight-electrode measurements of water holdup to
provide an approximate image of how the fluids are segregated in the
cross section of the casing. The fluid image greatly aids in the
interpretation of the spinner response.
The tool uses matchstick-sized electrical probes to measure the
resistivity of the wellbore fluid, high for hydrocarbons and low for
water. The probes are located inside the tool’s four centralizer
blades to protect them from damage. Opening of the blades positions
each probe at midradius in the casing. In some flow regimes, both
water holdup and bubble-count measurements may be obtained from the
output of the probe.
Local water holdup is equated to the fraction of the time that the
probe is conductive, whereas bubble count comes from the average
frequency of the output. The local water holdup from each of the
eight probes is used to generate the water/hydrocarbon distribution
in the well’s cross section.
The third component is the Reservoir Saturation Tool, often run in
conventional cased hole logging programs to assess the current state
of the reservoir. This tool is a pulsed-neutron log that can be
operated in nuetron-lifetime mode or spectral carbon/oxygen mode.
Its main applications are for estimation of oil, gas, and water
holdups and determination of water-phase velocity by oxygen
activation.
From a combination of the holdups, the cross-sectional area of the
wellbore, and the fluid velocities, the rates of the individual
phases are estimated as a function of position along the wellbore’s
axis.
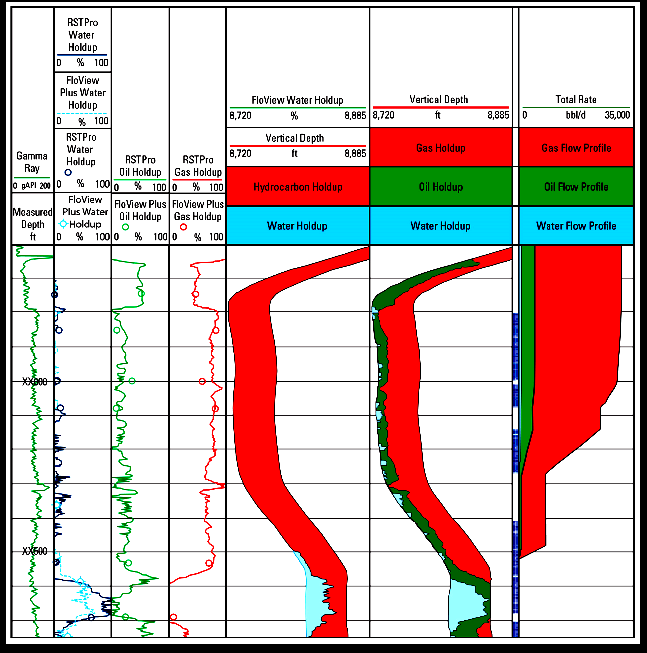
On
the right of the gamma ray and depth track, Track 2 displays water
holdup from the FloView Plus tool and three phase holdup log (TPHL).
Stationary measurements and continuous logging results are plotted
from both. Tracks 3 and 4 are TPHL log oil and gas holdup data.
Track 4 is the FloView Plus two-phase measurement plotted along the
trajectory of the horizontal section of the wellbore. Track 6 is a
similar plot of TPHL log holdup data for all three phases along the
wellbore trajectory. Track 7 is a flow rate profile computed from
TPHL log holdup data and the FloView Plus tool's velocity
measurements. The perforated interval is indicated between Tracks 6
and 7.
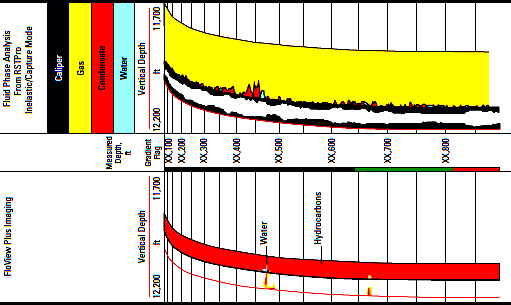
The water holdup plots of the TPHL log and FloView Plus tool's data
agree well over most of the interval. Above XX,500 feet, however, the FloView Plus tool is unable to measure the small water flow values
because of high water velocity and low holdup. The highest point in
the horizontal section of the well occurs at approximately XX,560
feet. Little fluid is produced from below that point, resulting in
high water holdup in the bottom of the well. From XX,560 to XX,800
feet, where the fluids are flowing downward, oil and water travel
faster than gas and, consequently, have lower relative holdup rates.
The insensitivity of the TPHL log's measurement to fluid velocity or
droplet size makes it possible to detect condensate in mist flow or,
as in this case, high-velocity water flow at low holdup. Above
XX,800 feet, the well becomes more vertical, slowing the oil flow and
increasing its holdup.
SYNTHETIC FLOWMETER LOGS
Optimizing perforation interval or horizontal well placement
can be aided by creating a cumulative flow capacity curve,
based on the permeability derived from the petrophysical
analysis of the prospective pay zone.
The KH% curve is presented with 0% at the left and 100% on
the right. This will match the shape of a spinner flowmeter
survey, with zero flow capacity at base of
pay and 100% at top of pay.
Intervals with the steepest slope on the KH% curve are the most productive
and should be perforated if not too close to water or gas.
Where the KH% curve is near vertical, no perfs are required.
Place horizontal well at or slightly below midpoint of the
steepest slope of the KH% curve. This may vary depending on
frac design and rock mechanical properties.
Permeability does not have to be well-calibrated to use this
technique since the KH% curve is normalized between 0 and
100%.
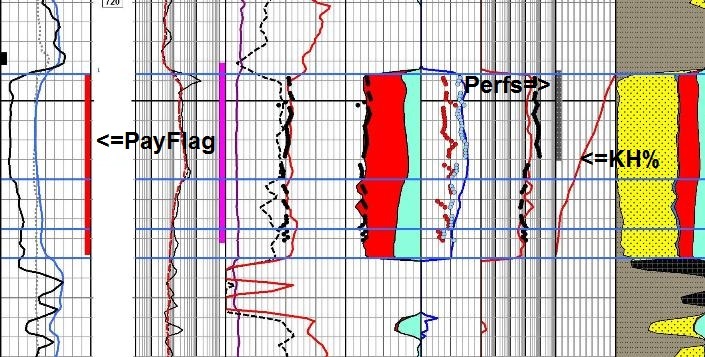
Grid lines are 1 meter spacing. Tracks 1, 2,
3 show GR, SP, PayFlag, resistivity, PE, neutron, and density
porosity.
Calculated and core porosity in Track 4 with saturations in Track 5,
calculated and core permeability in Track 6. Note excellent match to
core data (coloured dots). Higher SW in lower zone
is due to finer grained sand, not transition to water. KH% in Track
7 starts at base of PayFlag and runs up to top of PayFlag. Arrow
shows base of perforations. KH% curve shows 40% of possible flow
capacity has not been perforated. Since this is a gas expansion
drive reservoir, the perforations should be extended 2.2 meters to
capture at least 30% more flow capacity.
|