|
 CORE PERMEABILITY BASICS
Permeability is an intrinsic property of a
reservoir rock that indicates the flow capacity of the
reservoir. Reservoir engineers use permeability, reservoir pressure, and a few other
parameters to estimate oil and gas productivity. Petrophysicists
use core permeability values to help calibrate permeability derived
from well log data.
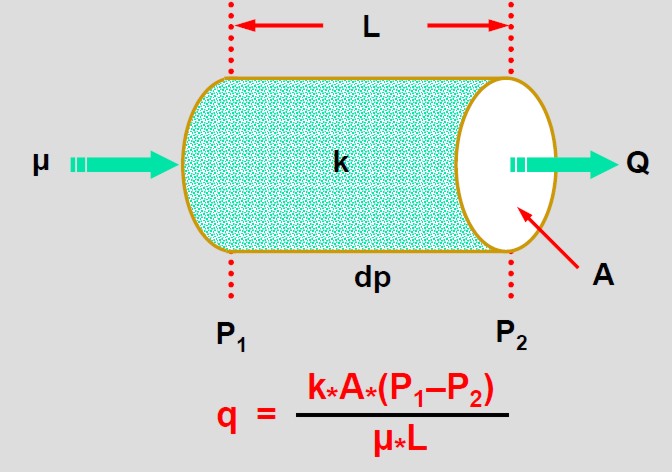
The Darcy flow equation defines permeability, and after some
rearrangement, is used to calculate permeability from laboratory
measurements.
1: Q = K * A * (P1
- P2) / (u * L)
Where:
Q = flow rate
K = permeability
A = area
P1 - P2 = pressure drop
L = path length
u = dynamic viscosity (aka absolute viscosity or viscosity)
To measure the permeability in the lab, dry gas is usually
used (air, N2, and He) in permeability determination because of
its convenience,
availability, and to minimize fluid-rock reaction. The
measurement of the permeability should be restricted to the low
(laminar/viscous) flow rate region, where the pressure remains
proportional to flow rate within the experimental error. At low
pressures, we assume the gases follow the ideal gas law.
CORE PERMEABILITY DEFINITIONS
Absolute or intrinsic permeability (Ka)
is measured with a single fluid in the rock. It is
often measured using dry air, giving rise to the term "air
permeability" (Kair). Nitrogen and carbon dioxide are also used.
When water is used as the single fluid, the result is called
"liquid permeability" (Kliq). Air perm is usually a little
higher than liquid perm. The Klinkenberg correction is used to
reduce air perm to an equivalent liquid perm.
Effective permeability is the permeability of a rock to one
fluid in a two phase system. For example, the effective
permeability of oil in an oil-water system (Ko) will be less
than absolute permeability. In the same rock and fluid system,
the effective permeability of water (Kw) could be higher or
lower than Ko.
Relative permeability
is the ratio of the effective permeability of a fluid at a
given saturation to some base permeability.
•Base
permeability is typically defined as
–absolute
permeability (Ka),
–air
permeability (Kair),
or effective
permeability to non-wetting phase at irreducible wetting
phase saturation, for example
Ko @ Sw
= SWir. Because the
definition of base permeability varies, the definition used
must always be confirmed before applying relative
permeability data
•noted along
with tables and figures presenting relative permeability
data.
In laboratory reports, many different measured values and
derived values are presented. Here are some of them:
* Kmax = maximum horizontal permeability at a particular
depth, derived by flowing air through the core in various
directions and recording the maximum value.
* K90 = horizontal permeability measured at 90 degrees to
the Kmax direction.
* Kv or Kvert = permeability measured vertically through
the core.
* KHi or K-Hi = individual layer flow capacity, derived by
multiplying the thicknes (H) of a layer by its permeability (K).
Kmax is usually used but the average of Kmax and K90 may be more
representative.
* KH = reservoir flow capacity, derived by summing all KHi
valees, excluding individual layers that failed cutoff criteria.
* Kavg = arithmetic average of permeability = KH / Hnet.
* Kgeo = geometric average of permeability -- see equations
HERE.
* Khar = harminuc average of permeability -- see equations
HERE.
Kgeo and Khar are used to model radial flow more accurately than
Kavg.
LAB PROCEDURE FOR MEASURING AIR PERMEABILITY
Cut core plugs from whole core
or use sample from whole core
Clean core and extract reservoir fluids, then dry the core
Flow a fluid through core at several flow rates
Record inlet and outlet pressures for each
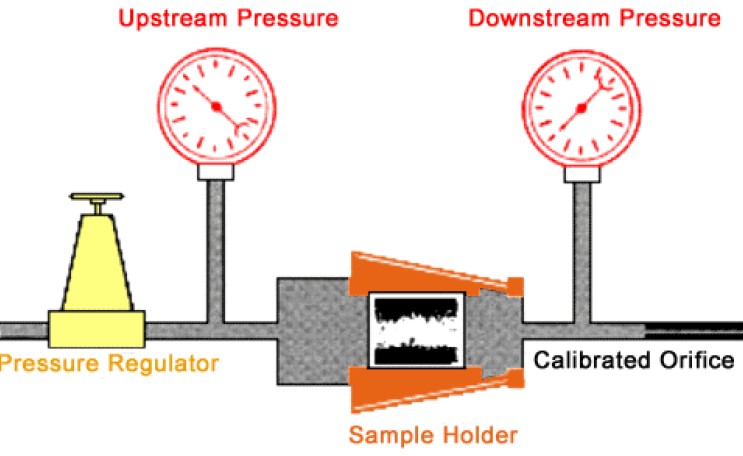
Laboratory apparatus for measuring permeability using air
and Darcy's Law
LAB PROCEDURE FOR MEASURING LIQUID
PERMEABILITY
Measure inlet and outlet pressures (P1
and P2) at several different flow rates
Graph ratio of flow rate to area (q/A) versus the pressure
function (P1 - P2) / L
For laminar flow, data follow a straight line with slope of
k/μ
At very high flow rates, turbulent flow is indicated by a
deviation from straight line
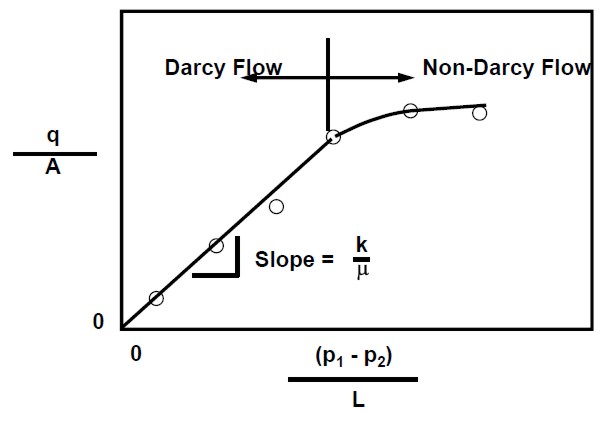
Finding permeability with liquid or high rate gas flow
KLINKENBERG EFFECT
Klinkenberg (1941) discovered that permeability measurements
made with air as the flowing fluid showed different results from
permeability measurements made with a liquid as the flowing
fluid. Air permeability is always greater than the permeability
obtained when a liquid is the flowing fluid. On the basis of the
laboratory experiments, liquids had a zero velocity at a
grain surface, while gases exhibited some finite velocity at the
same grain surface (slippage). This slippage results in a higher
flow rate for the gas at a given pressure differential. Klinkenberg also found that, for a given porous medium, as the
mean pressure increased, the calculated permeability
decreased.
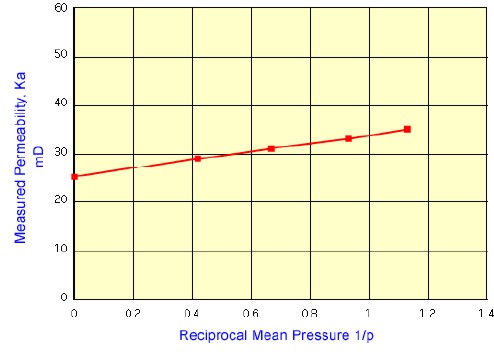 Klinkenberg
developed a method to correct gas permeability measured at low
mean flowing pressure to equivalent liquid permeability. A plot
of measured permeability versus 1/Pm is extrapolated to the
point where 1/Pm = 0 (Pm = infinity). This permeability
approximates the liquid permeability. Klinkenberg
developed a method to correct gas permeability measured at low
mean flowing pressure to equivalent liquid permeability. A plot
of measured permeability versus 1/Pm is extrapolated to the
point where 1/Pm = 0 (Pm = infinity). This permeability
approximates the liquid permeability.
2: Pm = (P1 + P2) / 2
3: Kliquid = Kgas / (1 + B / Pm)
Correction factor B is determined by
conducting the test at several flowing pressures and
extrapolating to infinite pressure.
Empirical correlations have been reported in the literature for moderate to high permeability
sandstones (Jones 1987):
4: Bhelium = 44.6 * (Khelium / PHIcore) - 0.447
5: Bair = 0.35 * Bhelium
For low permeability (<10mD) gas sands (Jones and Owens 1980):
6: B = 14.7 * (0.86 * Kair - 0.33)
Where:
Kgas = gas permeability (mD)
Kliquid = liquid permeability derived from gas permeability (mD)
P1 = inlet pressure (psi)
P2 = outlet pressure (psi)
Pm = mean pressure (psi)
B = constant for a particular gas in a particular rock type (psi)
PHIcore = core porosity (fractional)
The Klinkenberg correction is quite important for
low-permeability rocks and less important or unimportant for
high-permeability rocks. The value of kL obtained after applying
the correction represents the permeability to a gas at infinite
pressure or to a liquid that does not react with the component
minerals of the rock.
PERMEABILITY FROM MICRO-CT
SCANS
 Permeability is traditionally measured in the laboratory on
regularly shaped rock samples by forcing a fluid through the
rock and recording the resulting fluid flux and pressure drops.
CT Scanning complements and vastly expands laboratory
permeability data sets by numerically simulating fluid flow
through a direct digital representation of a real pore space
obtained by high-resolution 3D imaging. Such imaging and
simulations can be rapidly and massively conducted on physical
samples of irregular shapes and sizes that are impossible to
handle in the conventional laboratory. The pore volume and pore
size determined from the CT Scan are manipulated mathematically
by simu;ating the Navier-Stokes equation using the Lattice-Boltzman
Method, as shown below. Permeability is traditionally measured in the laboratory on
regularly shaped rock samples by forcing a fluid through the
rock and recording the resulting fluid flux and pressure drops.
CT Scanning complements and vastly expands laboratory
permeability data sets by numerically simulating fluid flow
through a direct digital representation of a real pore space
obtained by high-resolution 3D imaging. Such imaging and
simulations can be rapidly and massively conducted on physical
samples of irregular shapes and sizes that are impossible to
handle in the conventional laboratory. The pore volume and pore
size determined from the CT Scan are manipulated mathematically
by simu;ating the Navier-Stokes equation using the Lattice-Boltzman
Method, as shown below.
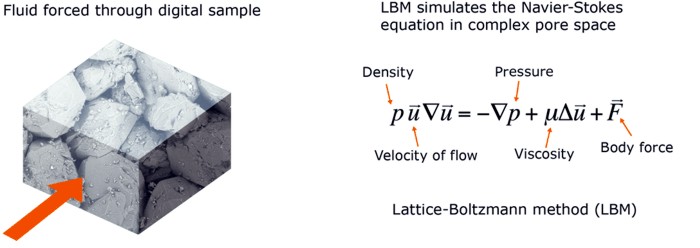
The slow
viscous flow needed for such
permeability estimates is simulated
using the lattice Boltzmann method (LBM).
LBM mathematically mimics the Navier-Stokes
equations of viscous flow by treating
the fluid as a set of particles with
certain interaction rules. Its great
advantage over directly solving the
equations of flow is that it directly
handles the boundary conditions on a
complex realistic pore surface. The
outcomes are consistent datasets of
permeability versus porosity
correlations and pore geometries for
various rock types, including tight gas
sandstone, carbonates, and friable tar
sands.
The
absolute permeability is computed in a
manner analogous to a laboratory
measurement: a pressure head or body
force is directly applied to a digital
sample. The resulting fluid flux is then
computed and permeability is calculated
according to the Darcy's equation.
Source:
www.ingrainrocks.com.
SAMPLE CORE ANALYSIS REPORT
|
02181815W4 |
#23708 |
731011 |
|
NOTE: Accumap has Kvert in K90 Column |
|
S# |
Top |
Base |
Len |
Kmax |
K90 |
Kvert |
Poros |
GrDen |
BkDen |
Soil |
Swtr |
Lithology |
|
|
feet |
feet |
feet |
mD |
mD |
mD |
Frac |
kg/m3 |
kg/m3 |
frac |
frac |
|
|
1 |
3499.19 |
3500.17 |
0.98 |
742.0 |
0.0 |
180.0 |
0.283 |
0 |
0 |
0.129 |
0.448 |
SS VF-F |
|
2 |
3500.17 |
3501.16 |
0.98 |
1196.0 |
0.0 |
694.0 |
0.297 |
0 |
0 |
0.123 |
0.450 |
SS VF-F |
|
3 |
3501.16 |
3502.17 |
1.02 |
622.0 |
0.0 |
266.0 |
0.276 |
0 |
0 |
0.111 |
0.520 |
SS VF-F |
|
4 |
3502.17 |
3503.16 |
0.98 |
223.0 |
0.0 |
50.5 |
0.271 |
0 |
0 |
0.129 |
0.479 |
SS VF-F |
|
5 |
3503.16 |
3503.88 |
0.72 |
837.0 |
0.0 |
171.0 |
0.278 |
0 |
0 |
0.110 |
0.504 |
SS VF-F PY |
|
6 |
3503.88 |
3504.57 |
0.69 |
407.0 |
0.0 |
113.0 |
0.287 |
0 |
0 |
0.118 |
0.466 |
SS VF-F |
|
7 |
3504.57 |
3504.67 |
0.10 |
|
0.0 |
0.0 |
0 |
0 |
0 |
0 |
0 |
SH |
|
8 |
3504.67 |
3505.26 |
0.59 |
514.0 |
0.0 |
365.0 |
0.253 |
0 |
0 |
0.151 |
0.398 |
|
|
9 |
3505.26 |
3505.49 |
0.23 |
100.0 |
0.0 |
2.6 |
0.201 |
0 |
0 |
0.134 |
0.358 |
SS VF-F SH INC |
|
10 |
3505.49 |
3505.98 |
0.49 |
401.0 |
0.0 |
120.0 |
0.254 |
0 |
0 |
0.143 |
0.268 |
SS VF-F SHBKS |
|
11 |
3505.98 |
3506.96 |
0.98 |
478.0 |
0.0 |
302.0 |
0.282 |
0 |
0 |
0.131 |
0.471 |
SS VF-F |
|
12 |
3506.96 |
3507.88 |
0.92 |
431.0 |
0.0 |
100.0 |
0.243 |
0 |
0 |
0.156 |
0.399 |
SS VF-F CARB INC |
|
13 |
3507.88 |
3508.47 |
0.59 |
777.0 |
0.0 |
556.0 |
0.277 |
0 |
0 |
0.119 |
0.389 |
SS VF-F |
|
14 |
3508.47 |
3508.87 |
0.39 |
831.0 |
0.0 |
383.0 |
0.275 |
0 |
0 |
0.136 |
0.422 |
SS VF-F CARB BK |
|
15 |
3508.87 |
3509.88 |
1.02 |
413.0 |
0.0 |
262.0 |
0.281 |
0 |
0 |
0.132 |
0.440 |
SS VF-F |
|
16 |
3509.88 |
3510.87 |
0.98 |
604.0 |
0.0 |
425.0 |
0.277 |
0 |
0 |
0.131 |
0.323 |
SS VF-F SH INC |
|
17 |
3510.87 |
3511.88 |
1.02 |
320.0 |
0.0 |
35.1 |
0.229 |
0 |
0 |
0.146 |
0.422 |
SS VF-F SH INC |
|
18 |
3511.88 |
3512.87 |
0.98 |
616.0 |
0.0 |
437.0 |
0.239 |
0 |
0 |
0.103 |
0.354 |
SS VF-F |
|
19 |
3512.87 |
3513.79 |
0.92 |
259.0 |
0.0 |
62.0 |
0.261 |
0 |
0 |
0.073 |
0.418 |
SS VF-F |
|
20 |
3513.79 |
3514.38 |
0.59 |
320.0 |
0.0 |
26.8 |
0.219 |
0 |
0 |
0.096 |
0.441 |
|
|
21 |
3514.38 |
3515.07 |
0.69 |
431.0 |
0.0 |
82.5 |
0.236 |
0 |
0 |
0.119 |
0.387 |
SS VF-F |
|
22 |
3515.07 |
3515.16 |
0.10 |
|
0.0 |
0.0 |
|
|
|
|
|
SH PY |
|
23 |
3515.16 |
3516.18 |
1.02 |
969.0 |
0.0 |
628.0 |
0.270 |
0 |
0 |
0.044 |
0.492 |
SS VF-F |
|
24 |
3516.18 |
3516.77 |
0.59 |
837.0 |
0.0 |
634.0 |
0.280 |
0 |
0 |
0.042 |
0.501 |
SS VF-F |
|
25 |
3516.77 |
3517.46 |
0.69 |
556.0 |
0.0 |
201.0 |
0.273 |
0 |
0 |
0.050 |
0.531 |
SS VF-F CARB INC |
|
26 |
3517.46 |
3518.28 |
0.82 |
706.0 |
0.0 |
338.0 |
0.262 |
0 |
0 |
0.046 |
0.487 |
SS VF-F |
|
27 |
3518.28 |
3519.07 |
0.79 |
502.0 |
0.0 |
377.0 |
0.238 |
0 |
0 |
0.079 |
0.494 |
SS VF-F CARB INC |
|
28 |
3519.07 |
3519.99 |
0.92 |
1136.0 |
0.0 |
183.0 |
0.263 |
0 |
0 |
0.063 |
0.501 |
SS VF-F |
|
29 |
3519.99 |
3520.58 |
0.59 |
825.0 |
0.0 |
291.0 |
0.265 |
0 |
0 |
0.052 |
0.563 |
|
|
30 |
3520.58 |
3521.46 |
0.89 |
1346.0 |
0.0 |
706.0 |
0.274 |
0 |
0 |
0.055 |
0.516 |
SS VF-F |
|
31 |
3521.46 |
3522.48 |
1.02 |
389.0 |
0.0 |
102.0 |
0.246 |
0 |
0 |
0.064 |
0.450 |
SS VF-F/M CARB INC |
|
32 |
3522.48 |
3523.47 |
0.98 |
165.0 |
0.0 |
11.9 |
0.219 |
0 |
0 |
0.058 |
0.408 |
SS VF-F/M CARB INC |
|
33 |
3523.47 |
3524.48 |
1.02 |
586.0 |
0.0 |
66.0 |
0.219 |
0 |
0 |
0.082 |
0.411 |
|
|
34 |
3524.48 |
3525.47 |
0.98 |
1035.0 |
0.0 |
395.0 |
0.244 |
0 |
0 |
0.051 |
0.391 |
SS VF-F |
|
35 |
3525.47 |
3526.48 |
1.02 |
514.0 |
0.0 |
187.0 |
0.199 |
0 |
0 |
0.073 |
0.360 |
|
|
36 |
3526.48 |
3527.47 |
0.98 |
526.0 |
0.0 |
89.0 |
0.205 |
0 |
0 |
0.046 |
0.481 |
SS VF-M |
|
37 |
3527.47 |
3528.16 |
0.69 |
1375.0 |
0.0 |
208.0 |
0.216 |
0 |
0 |
0.042 |
0.548 |
SS VF-M PY CARB |
|
38 |
3528.16 |
3528.88 |
0.72 |
287.0 |
0.0 |
95.0 |
0.207 |
0 |
0 |
0.066 |
0.462 |
|
|
|
|
|
|
|
|
|
|
|
|
|
|
|
|
Arithmetic Averages |
0.78 |
618.8 |
0.0 |
240.7 |
0.253 |
0.0 |
0.0 |
0.095 |
0.443 |
|
|
|
|
|
|
|
|
|
|
|
|
|
|
|
Core data listing for Shaly Sand Example
|