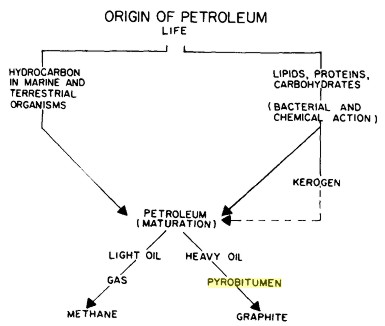
Organic
carbon is usually associated with shales or silty shales,
but may be present in relatively clean siltstone, sandstone, and carbonate rocks.
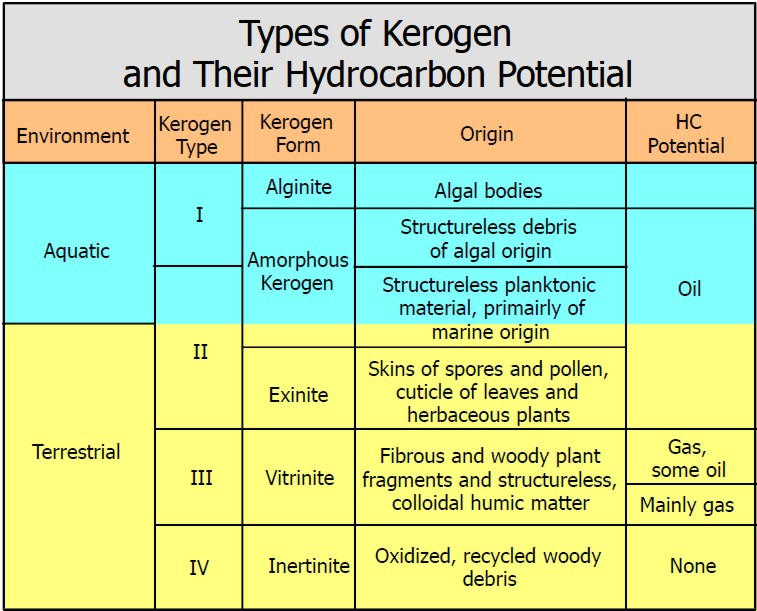
Organic carbon has a density near that of water, so it looks like porosity to conventional porosity logs. High resistivity with some apparent porosity on a log analysis is a good indicator of organic carbon content OR ordinary hydrocarbons OR both. Organic material can be classified according to the source of the material, as shown below.
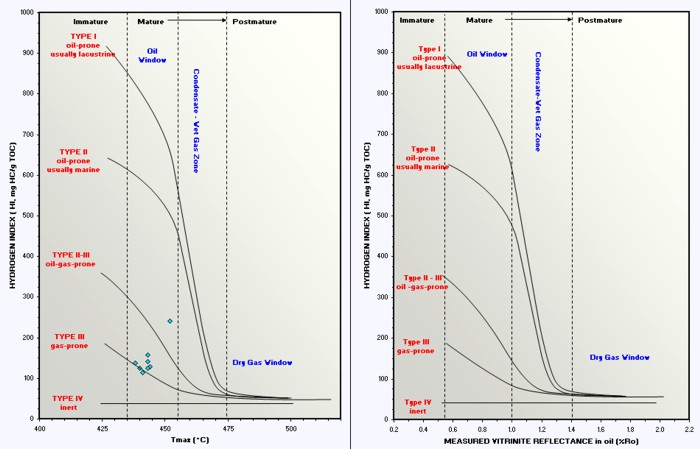
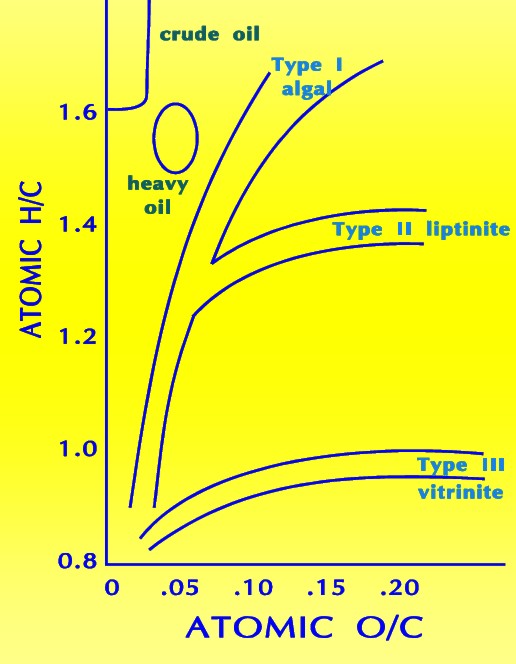
The classic Van Krevelen diagram
Cross-plots of both elemental H/C and O/C ratios or of HI and OI are utilized to discriminate four ‘fields’ which are referred to as Types I, II, III, and IV kerogen.
Type I kerogen is hydrogen rich (atomic H/C of 1.4 to 1.6: HI of > 700) and is derived predominantly from zooplankton, phytoplankton, micro-organisms (mainly bacteria) and lipid rich components of higher plants (H/C ratio 1.7 to 1.9).
Type II kerogen is intermediate in composition (H/C ≈ 1.2: HI ≈ 600) and derived from mixtures of highly degraded and partly oxidized remnants of higher plants or marine phytoplankton.
Type III kerogen is hydrogen poor (H/C ratio 1.3 to 1.5) and oxygen rich and is mainly derived from cellulose and lignin derived from higher plants.
Type IV kerogen is hydrogen poor and oxygen rich and essentially inert. This organic matter is mainly derived from charcoal and fungal bodies. Type IV kerogen is not always distinguished but is grouped with Type III.
The different types of organic matter are of fundamental importance since the relative abundance of hydrogen, carbon, and oxygen determines what products can be generated from the organic matter upon diagenesis. Since coal is comprised predominantly of Type III kerogen, there is little liquid hydrogen generating capacity. If the coal includes abundant hydrogen rich components (such as spores, pollen, resin, waxes - Type I or II), it will generate some liquid hydrocarbons. Although not common, some oil deposits are thought to be sourced by coals.
Note: Portions of the above Section, and the next Section, were taken verbatim (with moderate editing) from CBM Solutions reports.
Total organic
carbon is often taken to mean the same thing as kerogen, but this is
not the case. Kerogen is made up of oxygen, nitrogen, sulphur, and
hydrogen, in addition to carbon. The standard pyrolysis lab
procedure measures only the carbon, so total organic carbon excludes
the other elements.
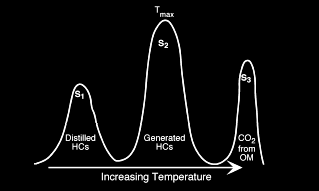
Where: Another lab procedure, called RockEval, burns both hydrogen and carbon, so the data needs to be calibrated to the standard method by performing a chemical analysis on the kerogen. Typically the organic carbon needs to be reduced by about 10% (the weight of the hydrogen burned) to match the standard method. Rock Eval is the trade name for a set of equipment used in the lab to measure organic content of rocks, as well as other properties of the organics that help to identify the kerogen type. Rock-Eval combusts a crushed sample of rock at 600ºC. Refractory organic matter such as inertinite does not combust readily at 600ºC so most coal samples yield Rock-Eval measured TOC values much lower than actual values because of incomplete combustion. Rock-Eval is not recommended for use with coals or source rocks with significant amounts of Type III and IV kerogen. A rock sample is crushed finely enough so that 85% falls through a 75 mesh screen. Approximately 100 mg of sample is loaded into a stainless steel crucible capped with a micro mesh filter. To ensure accuracy, standard samples are loaded at the beginning and end of the run. Any drift in data can be detected and the samples rerun if necessary. The analyzer consists of a flame ionization detector and two IR detector cells. The free hydrocarbons (S1) are determined from an isothermal heating of the sample at 340 degrees Celsius. These hydrocarbons are measured by the flame ionization detector. The temperature is then increased from 340 to 640 degrees Celsius. Hydrocarbons are then released from the kerogen and measured by the flame ionization detector creating the S2 peak. The temperature at which S2 reaches its maximum rate of hydrocarbon generation is referred to as Tmax. The CO2 generated from the oxidation step in the 340 to 580 degrees Celsius is measured by the IR cells and is referred to the S3 peak.
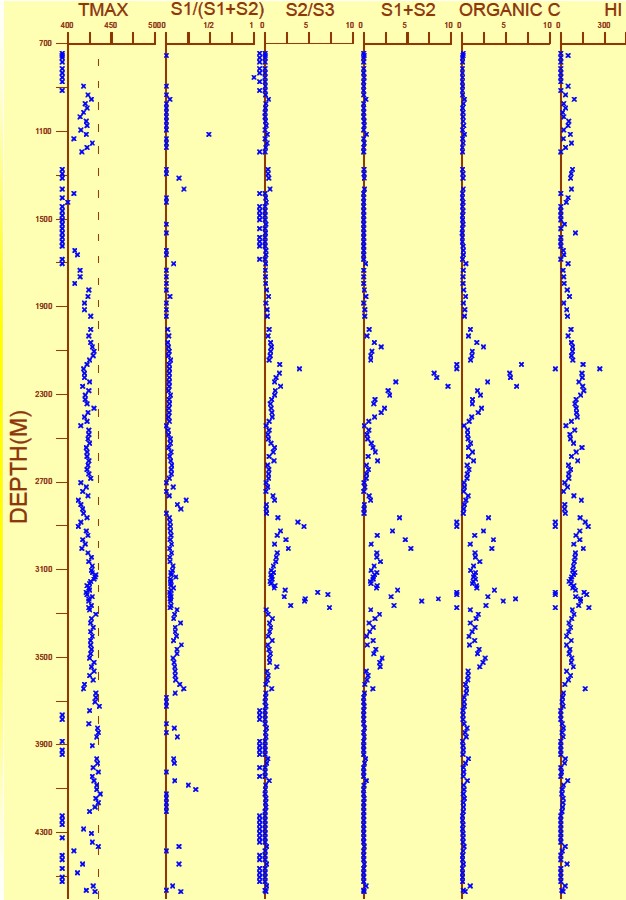
Laboratory measured TOC values (weight %) with measured and computed indices
An alternate method for measuring TOC by solution rather than pyrolysis is described below, from a 1980's TOC report from Australia. "The samples are analyzed for total organic carbon (TOC) according to AS 1038 Part 6. Moisture determinations are made to permit conversion to a dry basis. Carbon occurring as carbonate ion is determined to correct the gross carbon data to give the organic carbon content. This is done by driving off carbonate minerals with HCl acid. The crushed and sieved (100 mesh) samples are weighed and exhaustively extracted in a Soxhlet apparatus using a benzene-methanol mixture. After removal of methanol by azeotropic distillation with benzene, the residue in benzene is diluted with hexane and the hydrocarbon solution separated by filtration from the brown precipitate. The latter is then dissolved in methanol. The yield of methanol soluble material is determined gravimetrically.The hexane soluble portion of the extractable organic matter (E.O.M.) is weighed and chromatographed on silica. Elution with hexane gives predominantly alkanes and subsequent elution with hexane/benzene yields mainly monocyclic and polycycllc aromatic hydrocarbons. The eluted hydrocarbons are weighed, and then analyzed by gas chromatography / mass spectrometry."
Hydrocarbon
type versus temperature
Measurement of vitrinite reflectance was described as follows from the 1980's TOC report.
"Sample
chips or sidewall core samples are cleaned to remove drilling mud or
mud cake and then crushed using a mortar and pestle to a grain-size
of less than 3 mm. Samples are mounted in cold-setting resin and
polished ''as received", so that whole-rock samples rather than
concentrates of organic matter are examined. This method is
preferred to the use of demineralized concentrates because of the
greater ease of identifying first generation vitrinite and, for
cuttings samples, of recognizing cavings. The core samples are
mounted and sectioned perpendicular to the bedd1ng.
Tmax is also a useful indicator of maturity, higher values being more mature.
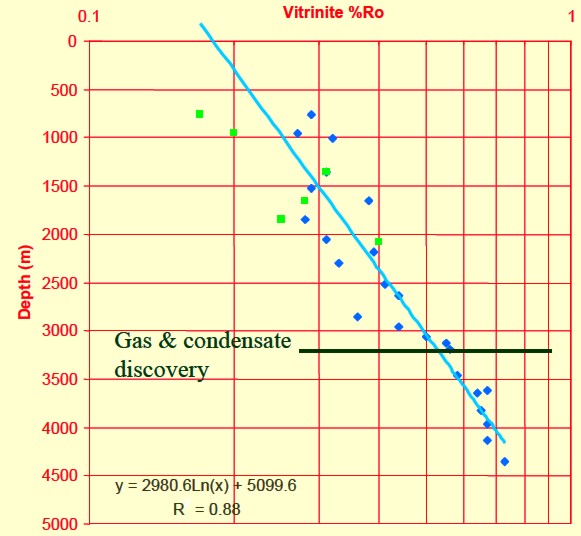
Graphs of HI vs Ro and HI vs Tmax are used to help refine kerogen type and to assess maturity with respect to the oil and gas "windows". Depth plots of Ro and Tmax are helpful in spotting the top of the oil or gas window in specific wells, and in locating sweet spots for possible production using horizontal wells.
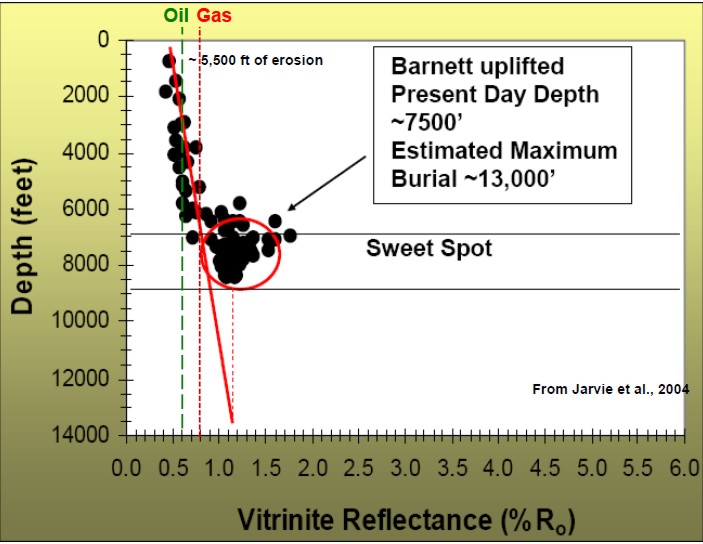
Thermal maturity as indicated by vitrinite reflectance (Ro) versus depth for a Barnett shale, showing "sweet spot" and oil versus gas “windows”.
|
|
||||||||||||||||||||||||||||||||||||||||||||||||||||||||||||||||||||||||||||||||||||||||||||||||||||||||||||||||||||
|
Page Views ---- Since 01 Jan 2018
Copyright 2023 by Accessible Petrophysics Ltd. CPH Logo, "CPH", "CPH Gold Member", "CPH Platinum Member", "Crain's Rules", "Meta/Log", "Computer-Ready-Math", "Petro/Fusion Scripts" are Trademarks of the Author |
|||||||||||||||||||||||||||||||||||||||||||||||||||||||||||||||||||||||||||||||||||||||||||||||||||||||||||||||||||||

|
||
| Site Navigation |
LAB TECH
MEASURING ORGANIC CARBON IN ROCKS
|
Quick Links |
 Measured results from a typical Rock Eval study will contain:
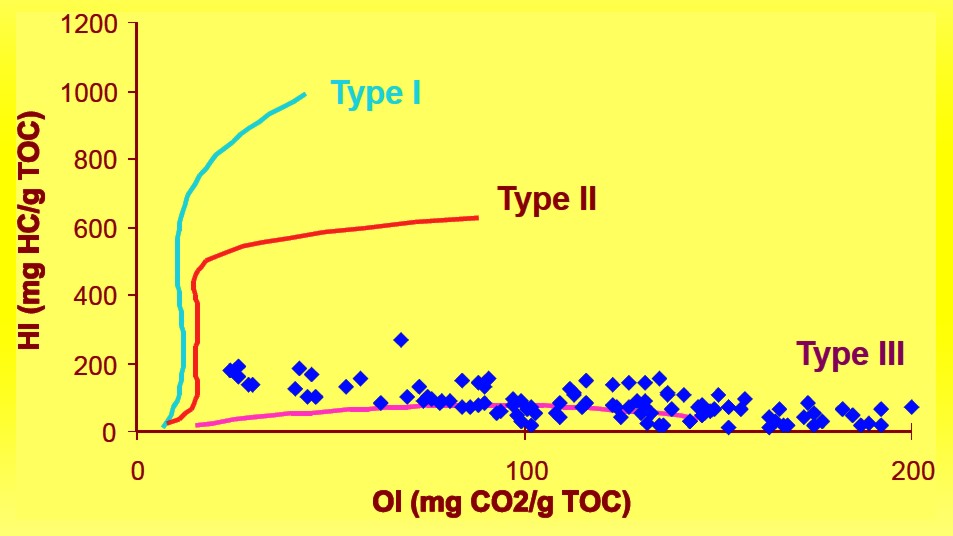
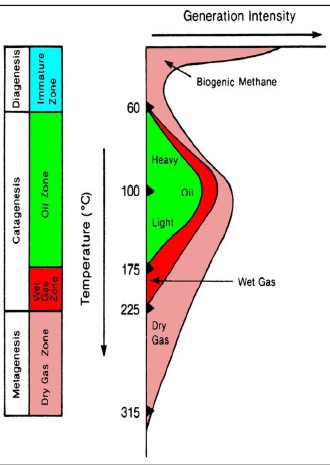 The
hydrocarbon potential of organic carbon depends on the thermal
history of the rocks containing the kerogen. Both temperature and
the time at that temperature determine the outcome. Medium
temperatures
(< 175 C) produce mostly oil and a little gas. Warmer temperatures
produce mostly gas.
The
hydrocarbon potential of organic carbon depends on the thermal
history of the rocks containing the kerogen. Both temperature and
the time at that temperature determine the outcome. Medium
temperatures
(< 175 C) produce mostly oil and a little gas. Warmer temperatures
produce mostly gas.