|
 POROSITY LOG SCALES
All porosity logs have been recorded in such a fashion as to
deflect to the left when apparent porosity increases. To
distinguish between shale and porous reservoir rock, we need
to observe the SP and GR curves as well as the porosity
curves. Visual analysis for porosity needs a holistic
approach - you cannot analyze a single log curve in
isolation.
Some
logs have a porosity scale determined at the time of logging. This
scale may or may not be appropriate for the rocks that were logged.
Some logs have a scale that must be transformed into an apparent
porosity scale. If logs are not recorded on porosity scales, or scales are inappropriate,
it is convenient to label the required porosity scale on the log.
The table below illustrates approximate porosity scales for a number
of individual logs. These values could be memorized so that the
analyst can derive approximate porosity at any time without reference
to chartbooks or calculators. Porosity obtained in this manner
will presumably be too high as no shale correction has been made.
A mental deduction for the amount of shale, estimated from the
gamma ray or SP log, should be included prior to finalizing any
visual interpretation.
Density and neutron logs can be displayed on sandstone scales or
Limestone
scales, regardless of rock type. This is a function of a switch
setting in the logging truck, which allows a sandstone scale to
be run in limestone rocks and vice-versa. If the scale name (e.g.
sandstone) does not coincide with the rock type (e.g. limestone),
the rules in the table above should be applied to derive the appropriate
scale. When using charts or calculators as opposed to visual methods,
use the rules pertaining to those methods.
Porosity
found by scaling the log in porosity units is termed the Total
Porosity (PHIt), and will vary for each log, AND IS NOT THE FINAL
ANSWER. NOTE: GAS AND SHALE AFFECT THE APPARENT POROSITY, SO POROSITY
DETERMINED BY SCALING THE LOG IS MERELY THE FIRST STEP IN A VISUAL
INTERPRETATION
EXAMPLES OF POROSITY SCALES
To apply the rules, draw the scale on the log using
the zero and 0.1 points listed. Label the 0.2, 0.3, 0.4 and 0.5
points by shifting an equal distance for each additional 0.1 fraction
of porosity.
For example, on English units sonic logs, create a sandstone
porosity scale by marking the 0.0 porosity point at 55.5 usec/ft and
the 0.1 point at 68.5 usec/ft. Add another 13 usec/ft for each
0.1 extra porosity to find the 0.2 and 0.3 porosity points.
Scaling Porosity Logs
As a second example, assume a limestone unit neutron porosity
scale, and convert it to a sandstone unit scale by exercising
the rule "add 0.04" to get sandstone from limestone
units.
The third example shown above is the case of scaling an obsolete neutron log
recorded in counts per second or other arbitrary units. The usual
approach is to pick a low point on the scale, and label it as
0.25 or 0.30 porosity units. Then label a high scale point as
0.01 or 0.02 porosity units and scale logarithmically between
these two points.
The data for the sonic log for Classic Example 1 is shown below with
its appropriate porosity scale in the correct units for further
work.
EXAMPLE OF VISUAL POROSITY ANALYSIS
Crain’s Rule #1:
The average of density and neutron porosity in a clean zone
(regardless of mineralogy) is a good first estimate for
Effective Porosity (PHIe).
Crain’s Rule #2:
The density porosity in a shaly sand is a good first
estimate for Effective Porosity (PHIe), provided logs are on
Sandstone Units.
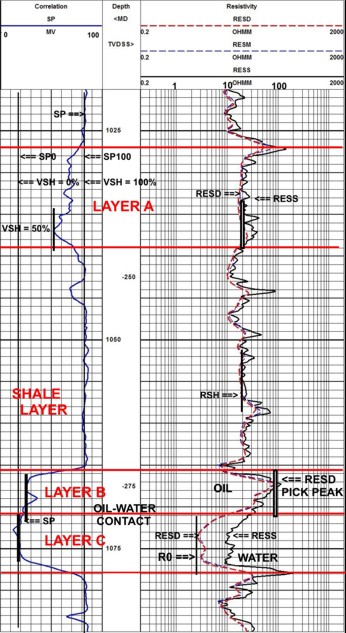 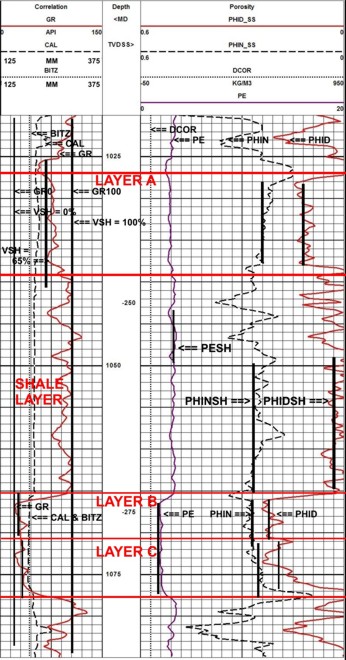
For zones of interest, draw bed boundaries
(horizontal lines). Then review the porosity logs: sonic,
density, and neutron. All porosity logs deflect to the left for
increased porosity. If density neutron data is available,
estimate porosity in clean sands by averaging the two log
values. In shaly sands, read the density porosity. IMPORTANT:
This is just an estimate and not a final answer.
The porosity for Layer A is 0.12 (Rule 2), Layer B is 0.24 (Rule
1), and Layer C is 0.19 (Rule 1). The shale interval has nearly
zero effective porosity.
|