|
This page describes thermal decay time logs profiles, in the order of their appearance over the years. This presentation style provides insights into tool evolution, and a specific tool’s capabilities and limitations. You will find most these tool types in your well files – here’s your chance to learn more about them.
This page describes the
standard TDT or PNL tools which have been the mainstay of
cased hole logging since the early 1970s. They are still in
use and many older logs are in your well files – these may
be useful as baseline logs to assist in reservoir moniroring
projects. More modern tools are called
Induced Gamma Ray
Spectroscopy or Advanced Pulsed Neutton Logs. On older logs, the primary derived value from the pulsed neutron device is the neutron decay time (TAU) for Schlumberger logs, and the Neutron Half Life (LIFE) for Dresser logs. TAU is the time for the neutron population to fall to 1/e (37%) of its original value and is related to the formation capture cross section (SIGMA), by the following equation: 1: SIGMA = 4.45 / TAU for the Schlumberger tool For the Dresser tool, LIFE represents Neutron half-life, the time required for the neutron cloud to decay to one half its original concentration. Therefore, 2: SIGMA = 3.15 / LIFE for the Dresser tool
On modern logs, and many older ones, the SIGMA curve is displayed and the above calculation is not needed. Where: SIGMA = capture cross section (capture units) TAU = neutron decay time (msec) LIFE = neutron half life (msec) Older TDT tools had a single pulsed neutron source; the modern version emits a dual neutron burst. Logs from either might be encountered so an understanding of their different designs and processing algorithms will help the analyst to understand the outputs and limitations of the tool.
References: 1. Thermal Neutron Decay Time Logging using Dual Detection
J.T. Dewan, C.W. Johnstone, L. A. Jacobson, W. B. Wall, R.P. Alger,
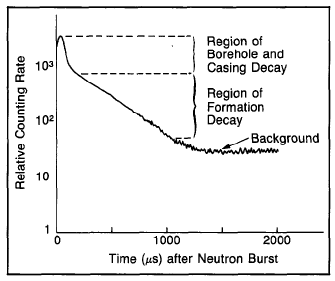
The neutrons are quickly slowed down to thermal energies by successive collisions with atomic nuclei of elements in the surrounding media. The thermalized neutrons are gradually captured by elements within the neutron cloud, and, with each capture, gamma rays are emitted. The rate at which these neutrons are captured depends on the nuclear capture cross sections, which are characteristic of the elements making up the formation and occupying its pore volume. The gamma rays of capture which are emitted are counted at one or more detectors in the logging tool during different time gates following the burst, and from these counts the rate of neutron decay is automatically computed. One of the results displayed is the thermal decay time, TAU, which is related to the macroscopic capture cross section of the formation, SIGMA, which is also displayed.
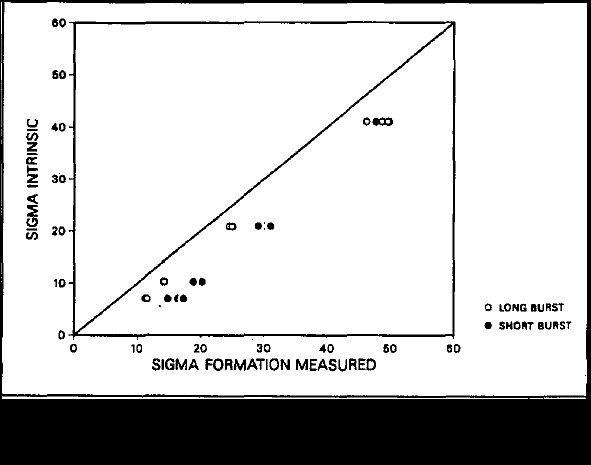
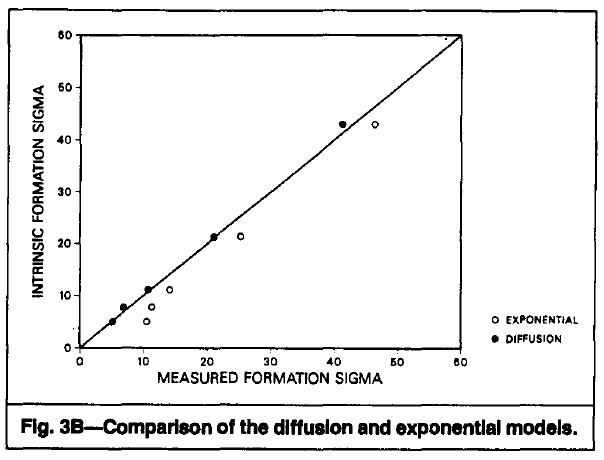
With older tools, the decay time curve was approximated using a sum of exponentials, from which the borehole decay contribution needed to be removed. The residual (non-exponential) diffusion was subtracted from formation sigma, using chartbook solutions based on laboratory calibrations. It was also necessary to make appropriate environmental corrections. The exponential method created a dependence of formation sigma on the nature of the borehole fluid. The modern dual burst system accounts explicitly for thermal neutron diffusion, using a closer solution to the neutron diffusion equation. This model precludes the use of chartbook and environmental corrections. The improved results are obvious in the cross-plot comparing measured formation SIGMA (both models) versus inherent SIGMA.
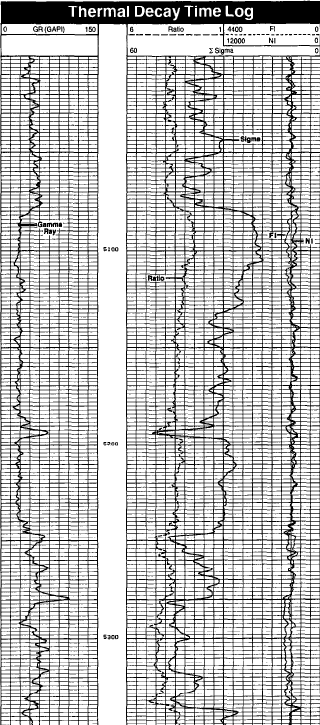
The Schlumberger TDT-K system utilizes
two detectors and two variable time gates (plus a background gate)
to sample the capture gamma radiation decay following the neutron
burst. The width and positions of the time gates, as well as the
neutron burst width and burst repetition rate, are varied in
response to signals that are related to SIGMA (or more precisely,
related to the formation decay rate, TAU). A hardware delay
following the burst allowed the borehole signal to decay, meaning
the updated TAU was generated mainly from the formation signal. The
main outputs are SIGMA and a ratio curve; the values were entered
into a chart to determine apparent porosity and apparent water
salinity.
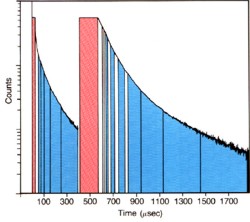
The TDT-M system utilizes sixteen time gates and one of four possible neutron burst widths and burst repetition rates. Counts from the sixteen gates are combined to form two "sum" gates (plus a background gate) from which SIGMA is computed. As in the TDT-K system, the combination of gates used to form the "sum" gates, as well as the burst width and repetition rate, are selected according to SIGMA (or TAU) of the formation. Because borehole diffusion is mainly a constituent of the near detector counts, this configuration allows SIGMA to be calculated preferentially using the far detector, giving a more accurate formation SIGMA. Two processing methods are possible: a real-time, single component wellsite method, and an offsite VAX model, in which 2 components are fitted independently; the offsite result is deemed accurate when the dual component results are in agreement. The wellsite model provides the initial SIGMA formation values to the offsite model. In general, the wellsite model is sufficient for monitoring water movement but the offsite model is recommended in heterogeneous or unknown lithologies, (e.g. having shales, clays or anhydrite), or in complex borehole geometries. The improved precision of the offsite model makes it a better choice for critical operations such as Log-Inject-Log. Other service companies offer similar tool designs.
The water saturation is based on the sum of the capture cross sections, in a mathematical treatment similar to the sonic, density and neutron logs. Here is the log response equation for the SIGMA measurement with only hydrocarbon and water in the porosity: 3: SIGMA= PHIe * Sw * SIGw (water term) + PHIe * (1 - Sw) * SIGh (hydrocarbon term) + Vsh * SIGsh (shale term) + (1 - Vsh - PHIe) * Sum (Vi * SIGi) (matrix term) Where: SIGh = log reading in 100% hydrocarbon SIGi = log reading in 100% of the ith component of matrix rock SIGMA = log reading SIGsh = log reading in 100% shale SIGw = log reading in 100% water PHIe = effective porosity (fractional) Sw = water saturation in reservoir (fractional) Vi = volume of ith component of matrix rock Vsh = volume of shale (fractional)
This equation is solved for Sw by assuming all other variables are known or previously calculated: 4: SIGw = 22.0 + 0.000404 * WS(ppm) 5: SIGm = Sum (Vi * SIGi) 6: PHIe = TPHI from log if available and no gas OR from open hole logs 7: SWtdt = ((SIGMA - SIGm) - PHIe * (SIGh – SIGm) - Vsh * (SIGsh - SIGm)) / (PHIe * (SIGw - SIGh))
*Note: the Sigma value of water varies with salinity, temperature and pressure (see SLB chart Gen-12, Capture Cross Section of NaCl Water Solutions) The ratio of counts in the near to far spaced detector is recorded and used as an estimate of formation porosity, in a fashion similar to the CNL neutron log*. Earlier TDT logs had only one detector, so no ratio porosity was available. In the dual detector tool, porosity is derived from a ratio of formation gate counts and sigma, and is corrected for borehole salinity.
*CAUTION: The early dual detector TDT
logs do not give a good value for porosity in dolomite reservoirs.
Always compare PHItdt to core or open hole log analysis whenever
possible.
Older TDT Logs - Single Burst Curves Units Abbreviations thermal decay time sec TAU capture cross section c.u. SIGMA casing collar mv CCL * gamma ray api GR
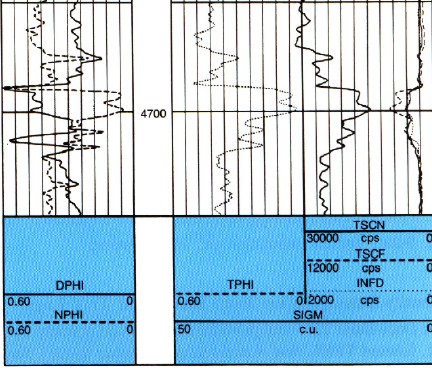
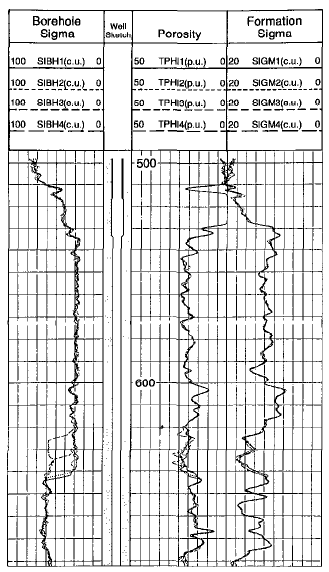
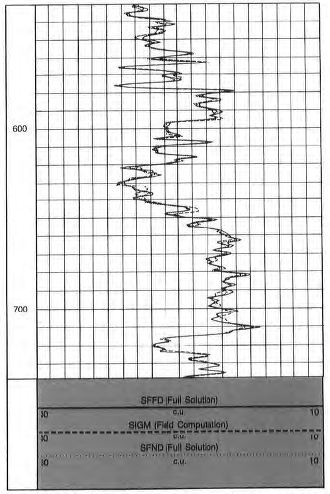
Modern TDT Logs - Dual Burst Curves Units Abbreviations thermal decay time sec TAU capture cross section c.u. SIGMA corrected borehole sigma c.u. SIBH borehole corr. formation sigma c.u. SIGM inelastic counts far detector cps INFD casing collar mv CCL near count rate cps NCPS, N1, TSCN (total selected counts for near detector) far count rate cps FCPS, F1, TSCF (total selected counts for far detector) * gamma ray api GR * ratio unitless RATIO * TDT Porosity fractional TPHI
|
|
|
|
Page Views ---- Since 01 Jan 2015
Copyright 2023 by Accessible Petrophysics Ltd. CPH Logo, "CPH", "CPH Gold Member", "CPH Platinum Member", "Crain's Rules", "Meta/Log", "Computer-Ready-Math", "Petro/Fusion Scripts" are Trademarks of the Author |
||

|
||
| Site Navigation | TOOL PROFILES THERMAL DECAY TIME and PULSED NEUTRON LOGS | Quick Links |