This page describes acoustic image logs profiles, in the order of their appearance over the years. This presentation style provides insights into tool evolution, and a specific tool’s capabilities and limitations. You will find most these tool types in your well files – here’s your chance to learn more about them.
Acoustic image logs are an economic replacement for resistivity
image logs for assessing structure
and stratigraphy of reservoir rocks and for Identification of
fracture intensity and fracture orientation. Tool design has improved
considerably since its introduction. Acoustic image logs are
identified by numerous tradenames that might not easily be
recognized, such as continuous borehole image log (CBIL) and
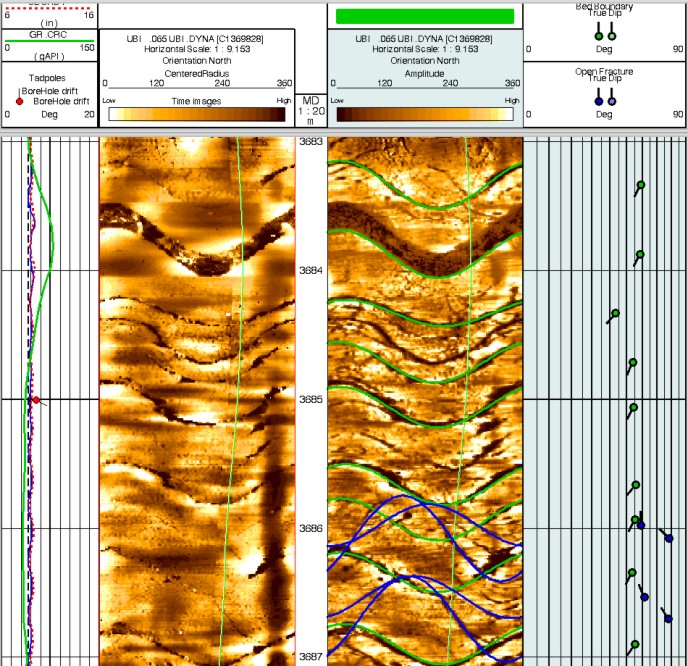
ultrasonic borehole imaging log (UBI). The tool has roots back to the 1970's and uses a rotating acoustic transducer/receiver operating at ultrasonic frequencies. The travel time of the sound from the transducer to the wellbore wall and back to the receiver is measured. This provides a complete image of wellbore diameter (a caliper log). Black colour indicates large diameter, white is "near" bit size. Fractures and wellbore breakout are easily seen (black). The poor resolution on older tools makes these artifacts larger than life and were quite misleading as to the width of fractures. Even modern logs exaggerate fracture width.
The
log also records the amplitude of the sound signal reflected from
the borehole wall. This is a measure of the acoustic impedance of
the rock. Low values represent shale or soft sandstone (shaded black
on the log) and high values represent competent rock such as
cemented sandstones or carbonates (shaded white on the log).
Fractures and breakout will appear black, as on the caliper image.
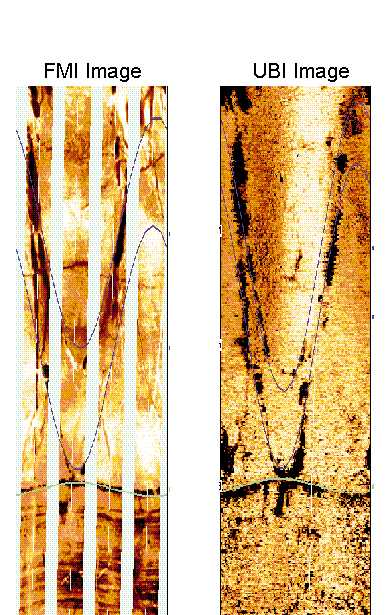
A resistivity image log has about 10 times the spatial resolution of an acoustic image log and 500 times the amplitude resolution, due to the difference in contrast between the resistivity and acoustic impedance ranges measured by the respective tools.
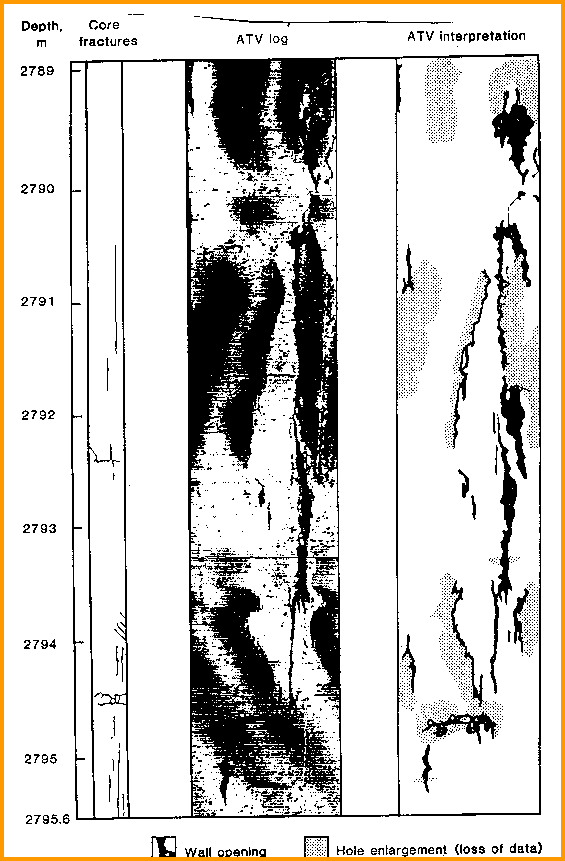
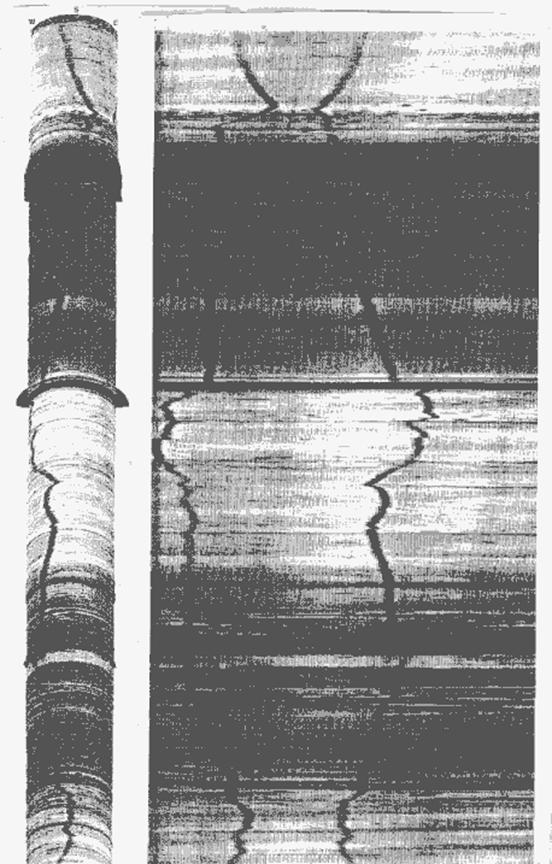
The resolution of the tool allows us to determine events of about 10 mm in width. Fractures are often accentuated in the wellbore by the drilling process, which breaks out the fracture on both sides of the opening. If it were not for this breakout, most fractures would not be seen by the acoustic imaging log, as their width is commonly less than 1 mm. Considerable research has being conducted to enhance the images, using both arrival time and amplitude of the sound waves, plus computer methods for image enhancement, especially edge enhancement to resolve fractures and bed boundaries. Modern acoustic image logs can be used effectively in more rugged boreholes than older versions because of the new processing techniques. Be aware of the age of the log before you start your analysis. The example below shows an older acoustic image log over a portion of a hole with a vertical fracture intersecting the borehole. The image is displayed as a 360 degree unwrap with East at the center of the image, and as an equivalent core image, with South in the middle.
Notice the enlarged borehole in some of the thin shale beds. The fracture plane is far from smooth and it wanders from one side of the borehole to the other. A dipmeter or older FMS might miss this fracture, or indicate discontinuous vertical fractures. Light colors are higher acoustic impedance, probably dolomite versus darker colored limestone and limey shales. Shale beds are black and washed out.
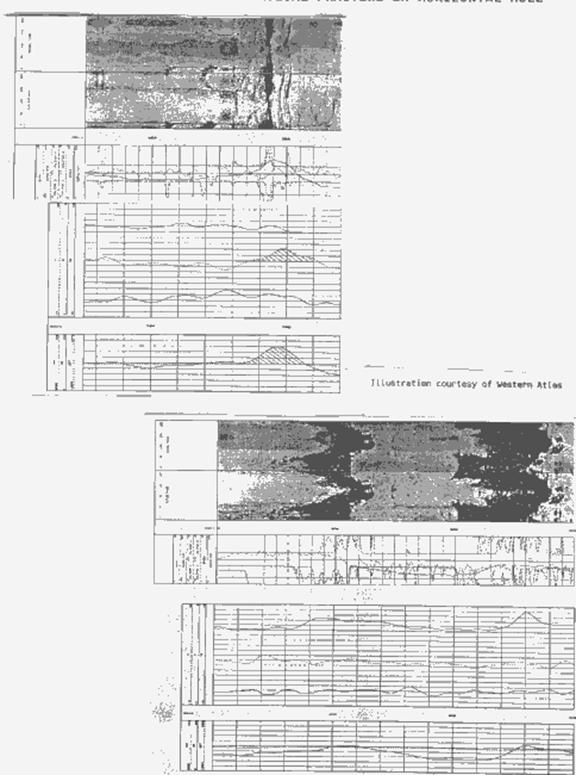
Below is a drill pipe conveyed acoustic image log run over a 1500 foot horizontal stretch from the intermediate casing shoe. The zone is an upper Cretaceous chalk in which fractures play a vital role in productivity. Most vertical wells penetrate only one or two fractures and deplete quickly. A horizontal well can penetrate many fractures and production can be significantly enhanced.
The acoustic image and uranium precipitation shown on the spectral gamma ray log indicate fractures clearly (top image in illustration above). This allows the operator to position completion hardware, such as centralizers and external inflatable casing packers correctly. In this example, the hole was designed to run close to the top of the chalk, and it penetrated the marly zone above in a few places, shown by the dark bands (lower image in illustration above).
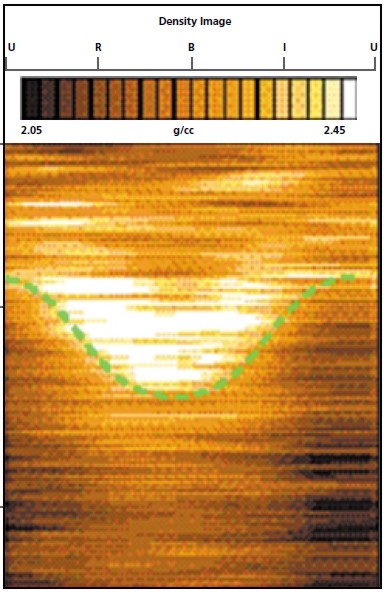
Logging while drilling (LWD) offers many alternatives that can be displayed as an image log. The example at right is a density image log. Low density values are shaded dark and can be interpreted as porosity or shale. A gamma ray log run with the drill string helps distinguish between these alternatives. White colours represent low porosity or tight rocks. Resistivity and acoustic images are currently in the field testing stage and may become commercial as LWD logging tools. |
|
||
|
Page Views ---- Since 01 Jan 2015
Copyright 2023 by Accessible Petrophysics Ltd. CPH Logo, "CPH", "CPH Gold Member", "CPH Platinum Member", "Crain's Rules", "Meta/Log", "Computer-Ready-Math", "Petro/Fusion Scripts" are Trademarks of the Author |
|||

|
||
| Site Navigation | TOOL PROFILES ACOUSTIC IMAGE LOGS aka TELEVIEWER LOGS | Quick Links |
 Aside
from open hole resistivity image logs, there are other alternatives
to acoustic images.
Aside
from open hole resistivity image logs, there are other alternatives
to acoustic images.