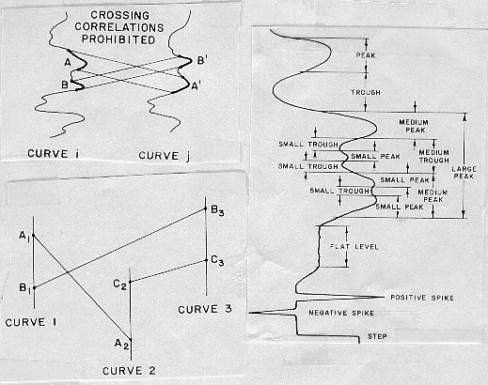
The following description was paraphrased from “An Approach to Detailed Dip Determination Using Correlation by Pattern Recognition”, P. Vincent et al, SPE Paper 6823, 1977. One of the objectives of GEODIP is to overcome the rigidity of the fixed correlation interval procedure and provide a density of information more closely related to the geological detail seen on cores. There was also the feeling that the dipmeter raw data contained more information than was actually being used, even by the improved processing achieved with clustering and pooling. After all, the electrodes had a resolution of 0.2 inches and often one or two foot data was being presented. Many features, such as peaks and valleys, are identifiable by eye from curve to curve on the dipmeter. These features have various thicknesses (from one inch to several feet), amplitudes, and shapes. Each feature may be considered to be the signature of a geological event in the depositional sequence. Moreover, the dip of the bedding is not necessarily constant, and may sometimes vary rapidly. The method of correlation by pattern recognition is best adapted to automatically detect these curve features, to recognize them from curve to curve, and to derive dips for the boundaries of each individual feature. Different curve features of the same type are often very similar and easy to confuse. The human correlator avoids this ambiguity by constant eye movements to confirm or invalidate hypothetical correlations. In so doing, the correlator implicitly, often unconsciously, applies some logic rules which are integrated into the perception process. In the GEODIP method, equivalents of such rules and safeguards are included, as far as they have been recognized, in the program logic. Programs of this type have been called expert systems, or knowledge based systems, because they contain the rules of experienced analysts. The method is constructed around a basic law justified by geological conditions of deposition, the rule of non-crossing correlations. This rule states that the layers are deposited one over another, so that they can wedge out but they cannot cross. The consequence is that if Event A appears above Event B on one curve, it cannot appear below B on another one. This rule induces a certain interdependence between all of the correlations. In this method, the correlations are not viewed as independent realities, but as parts of a more general structure having internal organization and rules. Where only two curves are considered, it is a simple matter to recognize crossover correlations and disregard them. But when more than two curves are involved complex logic is required within the computer program to perceive that the correlation (A1, A2), is inconsistent with the correlations (B1, B3) and (C2, C3). Actually, it is the set of the three correlations which is, as a whole, inconsistent. It cannot be inferred, from what is shown, which one is incorrect.
The goal of the computer logic is to select the largest set of curve to curve correlations that does not include any crossovers or implied crossovers. To meet this goal, a branch of modern mathematics called the theory of partially ordered sets has been applied to the description and consistency checking of sets of correlations between curves. While this theory is necessary to properly implement on a computer the rule of non-crossing correlations, an understanding of the mathematics is not needed to appreciate what it achieves. The
method of correlation by pattern recognition is composed of two
main phases: In phase one, each curve is analyzed individually with reference to a catalog of standard patterns or types of curve elements, such as peaks, troughs, spikes, and steps, and is decomposed into a sequence of such elements. At the end of the feature extraction phase, the curves are replaced by their description in terms of elements. Each
element is associated with one or two boundaries which give the
position of the element on the initial curve as well as a pattern
vector, which is a series of numbers characterizing the shape
of the element. The pattern vector for a peak contains a description
of its: Other features have their own unique list of parameters in their pattern vector. In
the correlation phase, the method tries to successively match
elements of one curve to similar elements of the others. The objective
is to recognize the same geological event as it appears on different
curves. The basic criterion is the comparison of pattern vectors.
To find these correlations, a coefficient is computed which is
a measurement of the likeness between any two elements, using
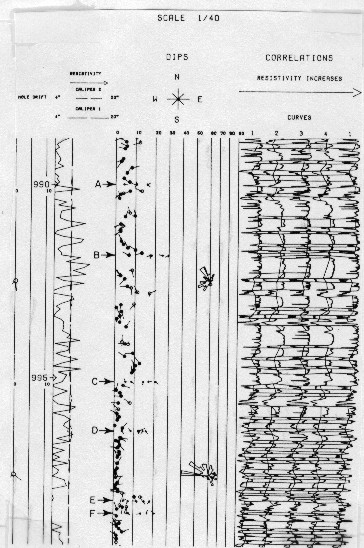
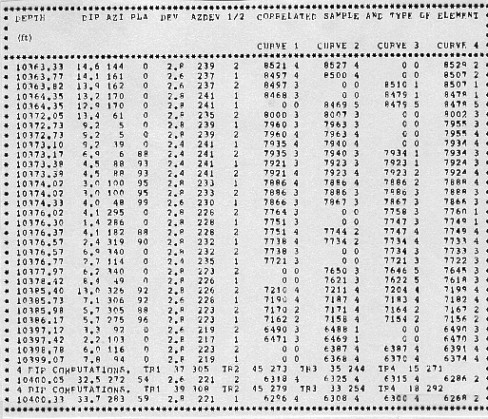
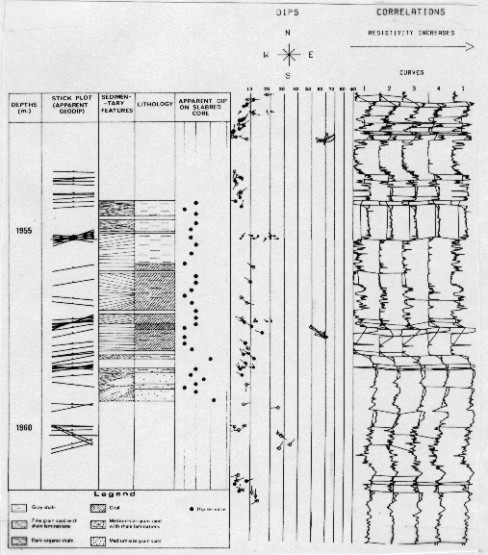
the following equation: Where: Low values for L mean a high degree of likeness. Then, the procedure attempts successive correlations according to a built in order of precedence: large troughs, then large peaks, then medium troughs,... The program retains already accepted higher precedence correlations in order to forbid crossing them in further attempts with correlations of lower rank. When two elements are considered to be a match, the corresponding upper and/or lower boundaries are then correlated. The resulting dips are computed from the displacements measured between these correlated boundaries and not those measured between the elements themselves. At the beginning of the correlation phase, an initial search angle, corresponding usually to the highest value of expected dip magnitude, is imposed. The initial search distance is computed from the input search angle, the orientation parameters, and the diameters measured by the tool at the particular level. As correlations are made and accepted, the search distances are modified, as necessary, to avoid crossing correlations. It may happen that no large element can be correlated with any large element of the same type on the search curve. To handle these cases in following passes, requirements are relaxed, for instance, by authorizing the correlation of a large element of the base curve with a medium element of the same type on the search curve. On the other hand, the correlation of unlike elements, such as peaks with troughs, is forbidden. Thus, the correlation phase proceeds by successive passes, searching first for the most obvious correlations, those having the lowest likeness coefficients. Each time a correlation is retained, it is memorized in order to limit subsequent search lengths for correlations with higher likeness coefficients. Pattern recognition correlation is also used in determining the velocity correction, allowing almost inch-by-inch detection of speed variations. The image below shows the graphic presentation made by automatic plotter. Because of the large number of dip results found, a depth scale of 1/40 (30 in. per 100 ft.) or 1/24 (50 in. per 100 ft.) is used instead of the usual 1/240 or 1/200 scales. This uncommon depth scale is better adapted for the high resolution available for very thin beds. The semi-horizontal lines connecting the traces represent the correlation of element boundaries.
With GEODIP there is no quality rating of the dip determination. The visual display of the curves and the correlations enable analysts to decide for themselves about the reliability of the correlations according to the character of the curves. Comparison to core data is one way to check the validity of the results of stratigraphic analysis.
|
|
||
|
Page Views ---- Since 01 Jan 2015
Copyright 2023 by Accessible Petrophysics Ltd. CPH Logo, "CPH", "CPH Gold Member", "CPH Platinum Member", "Crain's Rules", "Meta/Log", "Computer-Ready-Math", "Petro/Fusion Scripts" are Trademarks of the Author |
|||

|
||
| Site Navigation | DIPMETER PROCESSING PATTERN RECOGNITION METHODS | Quick Links |