|
 Beyond seismic - The "Other" Geophysical Methods
For this article, we are expanding the definition of
petrophysics to include the exploration methods performed on
or near the surface to locate potential ore bodies, or
hydrocarbon traps using all the physical principles we
remember from our oil field well logging experience. In
addition to seismic methods (covered in detail elsewhere in
this Chapter), some of the other approaches include gravity,
magnetic, radiometrics, resistivity, magneto-tellurics,
induced polarization and chargeability, transient magnetics,
and spectral remote sensing.
Gravity and magnetic data processing are covered in detail
HERE.
Seismic acquisition for mining applications
While the petroleum industry used seismic as its primary
exploration tool for a hundred years, it wasn’t until 1993
that Geological Survey of Canada began applying acoustic
technology to mineral exploration. Seismic had been viewed
as too expensive, the terrain too challenging, and the
coupling of the receivers to hard ground too uncertain to
merit serious consideration. However, with the depletion of
near surface ore bodies, these objections needed
re-evaluation. The burning question was, is the acoustic
impedance between ore body and host rock large enough to
generate a reflection?
Data was collected in various mining locales, including mineral
samples from various deposits for lab analysis, followed by the
acquisition of well logs, offset VSP surveys and eventually 2D
multi-channel seismic surveys. Special care was taken to adjust for
pressure differences between lab and subsurface, and to determine if
the high frequency, short propagation paths characteristic of
logging data could match the lower frequencies in a seismic survey.
The results were promising, and acoustic data is now used to map
lithologies, detect ore bodies, and find permeable zones (such as
sulphide mineralization controlled by fluid flow through faults),
using full waveform acoustic logs to help interpret seismic
reflections.
Vertical seismic profiles should also be considered as they “see”
below the bottom of the borehole and a considerable distance beside
the hole. A density log is also recommended to allow more accurate
calculation of acoustic impedance for seismic modeling and
tomography.
POTENTIAL FIELD METHODS
Surface seismic surveys rely on acoustic
impedance (density times seismic velocity) contrasts across a
geologic boundary. Other surface methods are employed which exploit
changes in rock density or naturally occurring geomagnetic waves.
These methods tend to cover large areas and have poor resolution;
despite these downsides, they are most effective when used in
conjunction with seismic. While seismic detects near-horizontal
rock boundaries, gravity and magnetics are better for steep
discontinuities such as faults.
Gravity Field Mapping and DATA Processing
These surveys, which locate anomalous rock density, can be acquired
on land or water and tend to be popular in frontier areas. The main
purpose of a gravity survey is to define lithology, structure, and
potential ore bodies. These methods have benefited from the
widespread use of GPS; GPS antenna can be placed on receivers and
transmitters in airborne systems. Gravity surveys have been used
with magneto-telluric (MT) surveys and magnetics to map basalt
covered sediments (10).
Corrections for station elevation, surrounding terrain elevation
(using digital surface maps and digital Hammer Charts, and Bouguer
Anomaly are required. Subtraction of 3rd order regional
surface from corrected data set will give contour map of the Bouguer
gravity anomaly, which can be used to plan next steps in the
exploration program. (11)
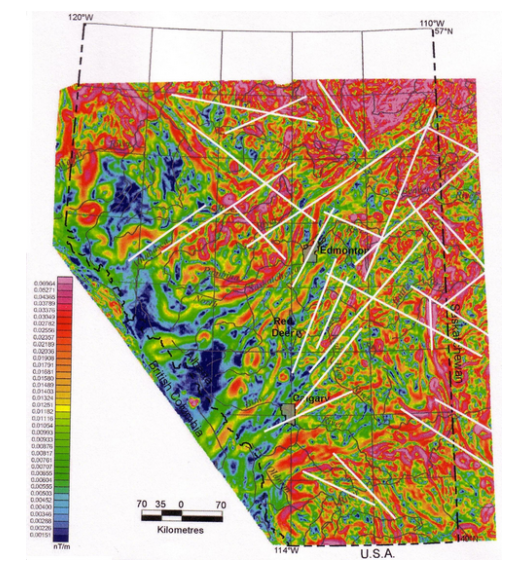
Horizontal-gradient magnetic map of Alberta showing
lineaments (white lines). Lyatsky et al., 2005.
Magneto-tellurics (MT)
This passive geophysical method measures the naturally occurring
electromagnetic waves generated by solar wind and lightning above
the earth to image the subsurface in terms of resistivity. MT is
used in remote areas as a lower cost alternative to seismic.
(14)
Surface receivers record horizontally and mutually orthogonal 2
components of electric and 3 components of the magnetic fields. The
variation and amplitude of the signals are interpreted using the
magneto telluric impedance, Z. This method has been used since the
1950s. In recent time it is being used to explore for and monitor
geothermal fields. (13) In 2018, the US began to compile
an open-source repository of these data.
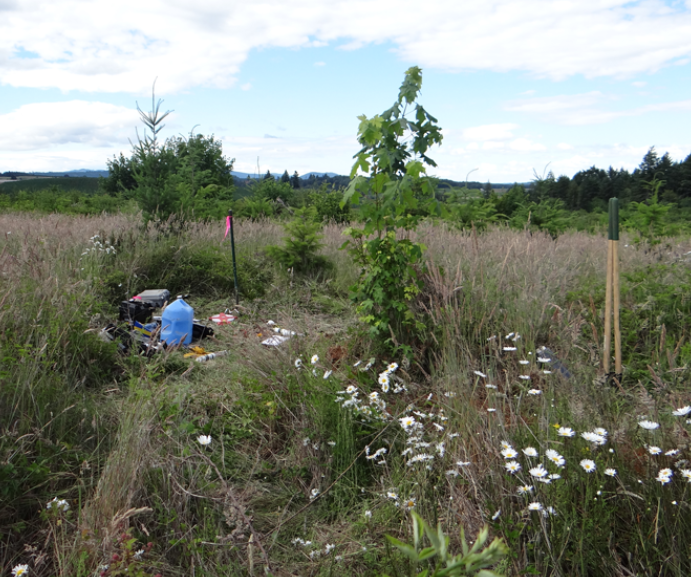
Magneto-telluric site in Oregon
a magneto-telluric system is connected to a magnetometer and two
sets of electrodes to collect magnetic and electric field data.
Subsurface Resistivity Mapping
Subsurface resistivity measurements are made using electrodes
planted in the ground and a power source. Different electrode arrays
vary, with a dozen or so well documented arrangements. Electrode
arrays were developed in order to make field measurements more
efficient and data interpretation easier.
Schlumberger Array
This subsurface geophysical exploration method using induced
electrical current was developed by Conrad Schlumberger in the early
1900s. He used direct current (DC), but the polarity was reversed at
a rate that prevented charge buildup in the earth. Two current
electrodes were driven into the ground some 50 to 200 meters apart.
Two measure electrodes were placed symmetrically between and inline
with the current electrodes, some distance away from the current
electrodes to prevent “edge effects”. The voltage measured was
inversely proportional to the resistivity of the ground between the
measure electrodes. The depth of penetration of the measurement
increased with increased electrode spacing, so multiple spacings
were run to obtain a “3-D” image of the resistivity.
In sediments, low values could mean aquifers or clay/shale beds;
higher values suggested hydrocarbons or tight rock. In hard-rock
country, low resistivity suggested massive sulphides or metallic
minerals. Other uses include clay alteration around hydrothermal
zones, lithology and structural controls on mineralization.
Successful interpretation was not guaranteed.
Awareness of this uncertainty led to more recent work where ERT
(Electrical Resistivity Tomography) is acquired with IP survey data
to successfully image galena veins within a granitic host rock,
beneath a sedimentary cover layer. (4)
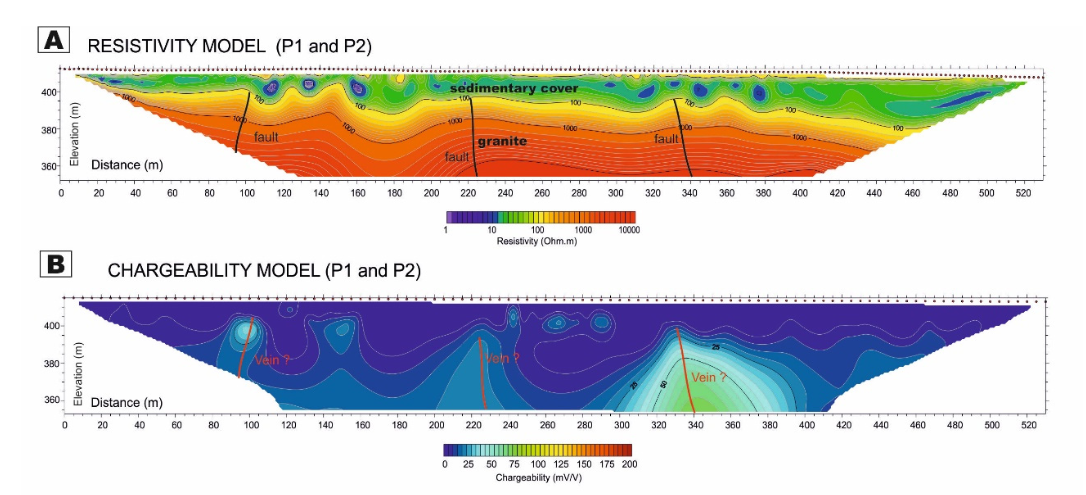
Combined data from ERT survey (A) and IP model (B) to
detect narrow galena veins in granite. Model A clearly
distinguishes the sedimentary cover from the granite; IP anomalies
show the veins. (4)
Mise-a-la-Masse Array (MALM)
Loosely translated from French, Mise-a-la-Masse
means “charged body”. This method was very popular in
the 1920s and 1930s for searching out ore bodies.
This technique is unique to mining; its
purpose is to demarcate highly conductive masses such as sulphides
and contaminant plumes.
This method is still in use today. Mise-a-la-Masse is unique
because the conductive mass being examined is itself used as one
current electrode, with a second current electrode placed 5-10 times
distant from the size of the conductive volume being investigated.
Current is injected across the current electrodes and the potential
voltage distribution radiating outwards from the injection borehole
gives an idea of the shape and volume of the mass. (5)
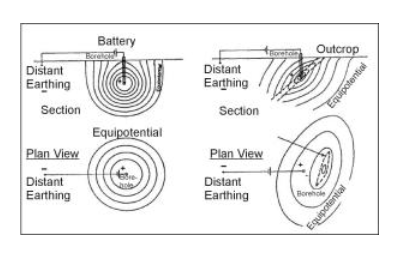
The left side of the diagram shows current potential
lines in a homogeneous material; to the right, equipotential lines
are distorted by a conductive ore body, which pushes the lines away,
roughly delineating the ore mass. (5)
Induced Polarization Methods (IP)
Induced polarization (IP), is an electromagnetic method in
widespread use in the mining industry. It is a method to image the
conductivity and chargeability of porous rocks. It is most commonly
used to delineate disseminated and massive sulphides within a host
rock.
For a 2 or 3D output, a Wenner-Schlumberger configuration selects
combinations of electrodes in groups of four (two current electrodes
and a pair of non-polarizable potential electrodes) applied on the
ground. Apparent chargeability and resistivity are recorded by each
electrode and the measurement assigned to a geometric depth in the
ground. (4)
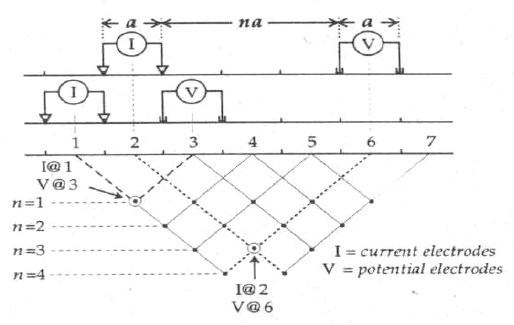
Simplified acquisition scheme for apparent chargeability
and resistivity. (4)
When a charging current is turned off, the voltage decays over a
finite time (discharging) back to zero. When the current is turned
on, voltage builds up over a finite time to a maximum applied
value. The current is, for a time, stored in the ground
(capacitance), causing some material to become polarized. This
phenomenon is called induced polarization. Chargeability is
affected by grain size, mineral type, mobility of ions in pore
fluid, interactions between solid surfaces and fluids (such as clay
particles in the fluid), and surface area of the material. For
example, illite, a clay, which has a much greater surface area than
sandstone, tends to hold a charge, whereas the latter (a possible
host rock) does not. IP surveys are useful in hydrogeology, to
isolate saline water from clay, which both have low resistivity.
Chargeability can be measured in the time domain, calculated as the
normalized area underneath the decay curve indicated in figure 5d
below. The data are inverted, resulting in a resistivity model
which quantifies the rock above the deposit and a chargeability
model which images the deposit itself. Chargeability can be measured
in both frequency and phase domains.
(7)
In the latter, the data is solved for MF, or metal factor, in
Siemens per meter (S/m). (6)
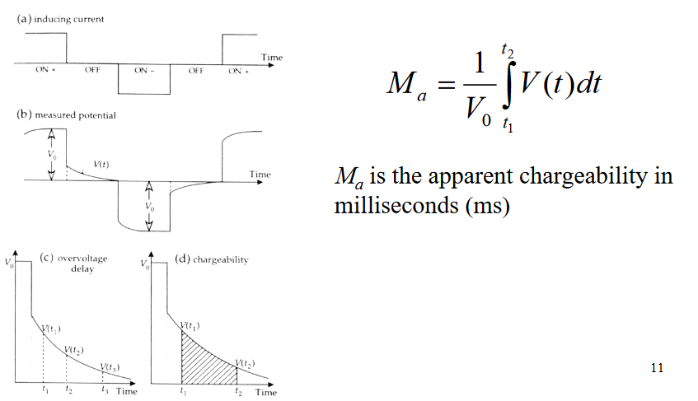
Induced Polarization in time domain showing a) on/off time
increments of inducing current, b) measured potential, c) overvoltage delay and d) calculation of apparent chargeability.
(6)
Multiple logs must be run for a definitive result. For example,
disseminated sulphides, which gold deposits could be associated with,
can be resistive or conductive, plus resistivity can appear lower
due to either the presence of clays or ore minerals. There is a
large range in chargeability between different materials, from 0
msec for groundwater, up to 30 msec in a Precambrian Gneiss. For
specific minerals, chargeability is dependent on the concentration
within the host rock. There is a large spread of possible values,
ranging from 13.4 msec in a 1% sample concentration of pyrite, down
to 2.2 msec in a similar concentration of magnetite.
This anomalously high chargeability of pyrite has sparked a novel
use for IP in hydrocarbon exploration. Minor amounts of hydrocarbon
leaking through the top seal of a deeper hydrocarbon trap can form a
pyrite rich alteration zone. These halo-shaped zones can be
identified as anomalies with an IP survey, helping to reduce
drilling costs. (8)
aeromagnetic Methods (EM, TEM)
These surveys can be acquired by aircraft flying a track or grid
pattern at relatively low altitude, or on the ground. They measure
spatial variations in Earth’s magnetic field over the surveyed area,
which are usually related to mineralogy.
The main objective of an aeromag survey is direct detection of iron
ore, subsurface lithology, and structure, as well as the extent of
permissive terranes (areas
that can contain a certain type of mineral occurrence or ore
deposit).
It can be
used to identify hazardous material from nickel/copper or asbestos
in serpentine. Like IP, TEM has been used to map geochemical
anomalies and oil-water contacts in shallow hydrocarbon reservoirs -
a lot of this investigation has been done in Russia. (10)
Like IP, the data can be represented in the time domain (TEM:
Transient ElectroMagnetic), or the frequency domain (EM). In the
frequency domain, a current is transmitted continuously as a single
frequency, which works well for shallow targets.
For helicopter conveyed TEM, the transmitter coil is fixed to a
rigid frame suspended beneath a helicopter, with a receiver
positioned centrally within the frame. A DC current is run through
the transmitter, then rapidly switched off, generating a square
wave. This in turn generates a time-varying magnetic field in the
subsurface which instigates eddy currents. These currents cause the
onset of a secondary magnetic field. The receiver coil measures
this secondary field’s strength and temporal response, and data is
displayed as time/magnitude decay curves. The resultant time
amplitude data is inverted to arrive at a resistivity image of the
subsurface.
When deployed by a fixed wing airplane, the receiver, or bird, is
towed behind in an offset configuration. A ground-based system has
a similar transmitter/receiver arrangement as the helicopter,
providing information about the ground directly beneath the loops.
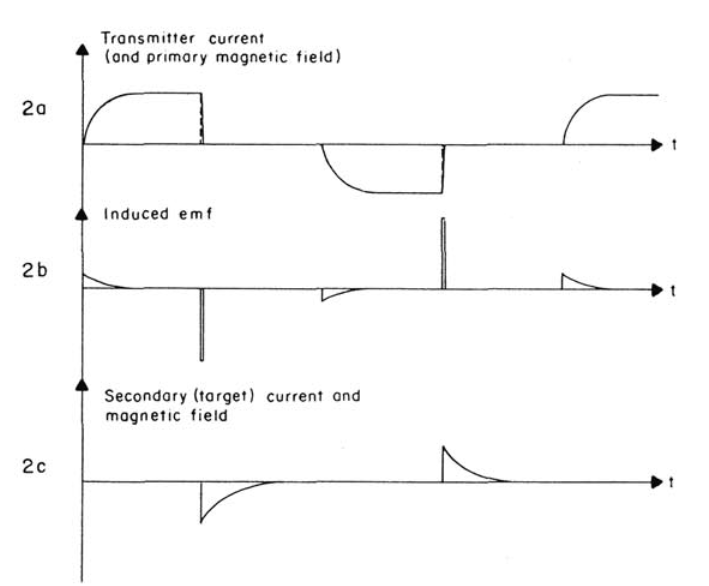
TEM system waveforms: 2a) transmitter current, 2b) the
induced electromotive force, 2c) the secondary current and magnetic
field.
Aeromag requires data corrections for flight altitude and flight
track closure errors (pre-GOS only). Subtraction of 3rd
order regional surface from corrected data set will give contour map
of the magnetic anomaly. An optimized borehole drilling and coring
program is derived from this map. (17)
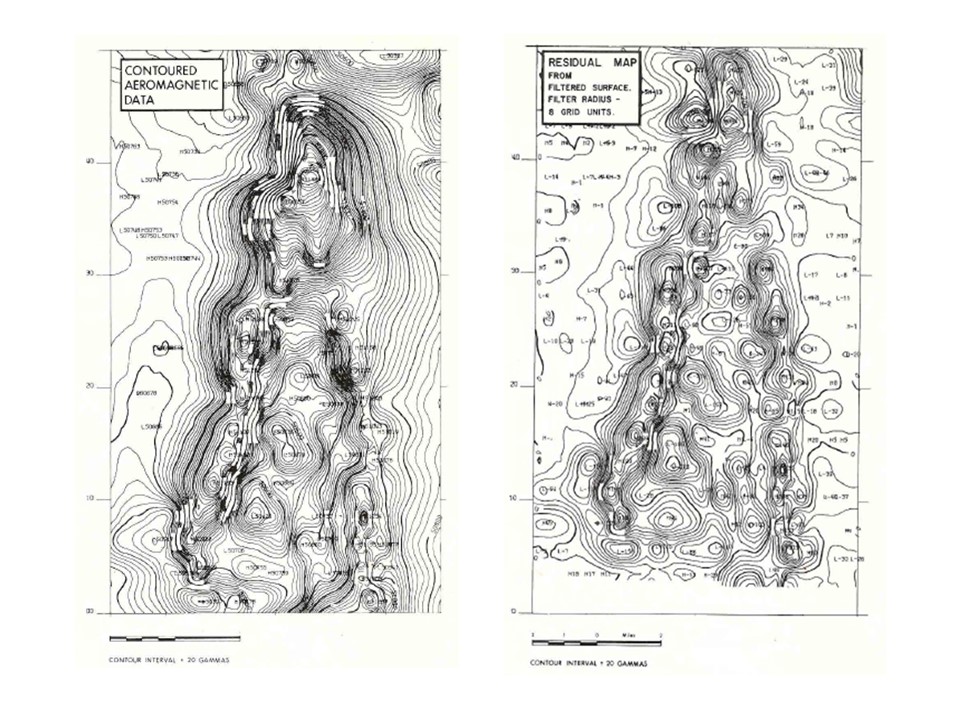
Contoured Aeromagnetic data (left), post-processed 3rd
order residual map of same dataset (right).
Unsurprisingly, electromagnetic measurements can be complicated by
the IP effect. This occurs where the earth is neither acting as a
resistive nor conductive body but instead acts as a capacitor. In
cases where this is known to be a problem, the data can be inverted
using a special model which inverts not just for resistivity but
also for IP effects. A description of this workflow can be found in
reference 15.
Current trends in TEM involve complex forward modeling of massive
sulphides, with a focus on recognizing various possible morphologies.
(18)
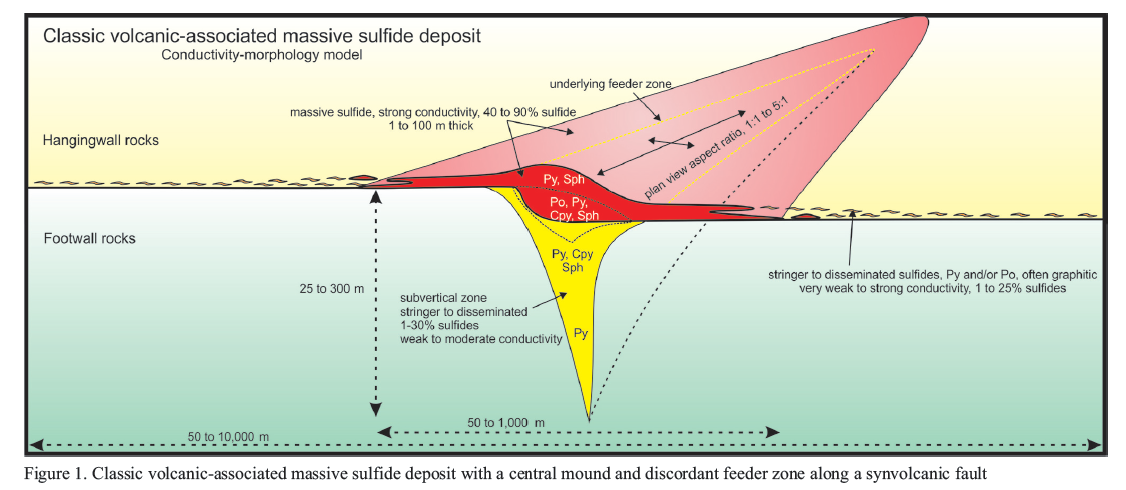
Model morphology of classic volcanic-associated massive
sulphide deposit with central mound and discordant feeder along a synvolcanic fault.
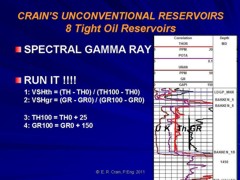
Radiometric Field Mapping and data processing
These surveys can be acquired by aircraft or on land surface. They
measure natural occurring radiation from potassium, thorium, and
uranium. Also known a gamma-ray spectrometry, their main purpose is
direct detection of uranium prospects.
Thorium increases in felsic rocks, indicating alkalinity, which in
turn provides an indication of oxidation of sulphides, leading to
faster uranium mobilization. Potassium alteration associated with
hydrothermal ore deposits can also be detected. Other uses include
heat flow studies and environmental mapping.
Recorded data requires corrections for flight altitude and flight
track closure errors (pre-GPS only). Subtraction of 3rd
order regional surface from corrected data set will give contour map
of the radiometric anomaly. It is interesting to note that combined
airborne magnetic and radiometric surveys, being the most
cost-effective geophysical survey method, have become a means to
“stimulating mineral exploration” worldwide. (19)
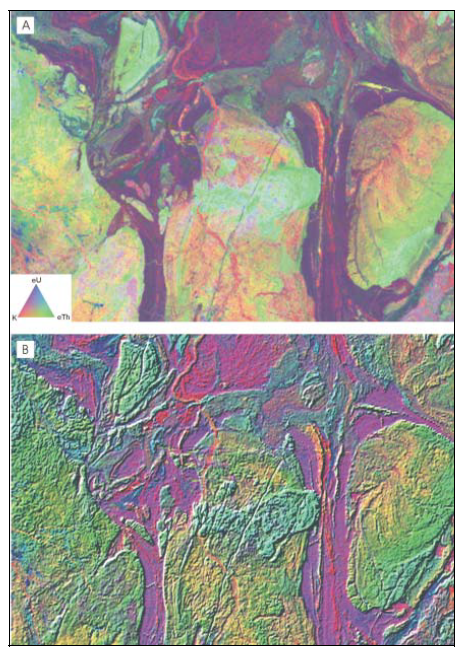
Ternary radioelement map showing abundance K (red), Th (green), U (blue). B: IHS composite image.
|