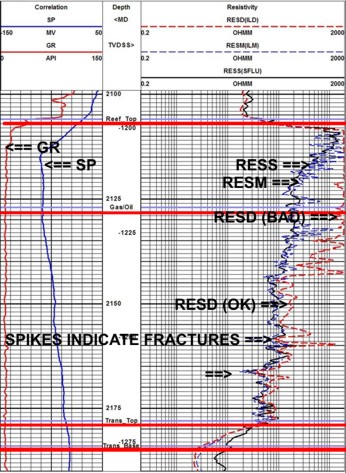
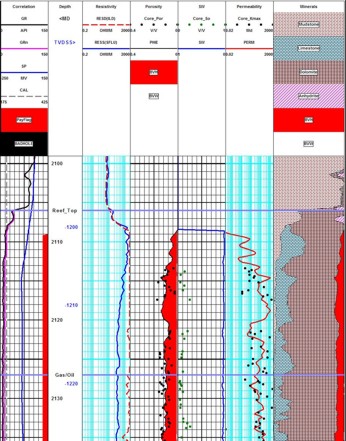
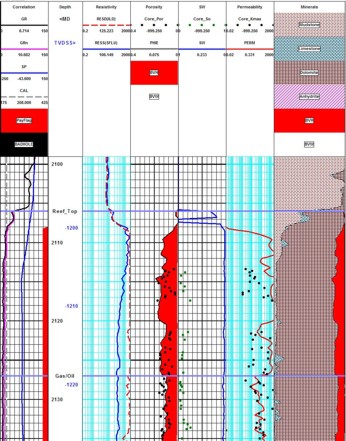
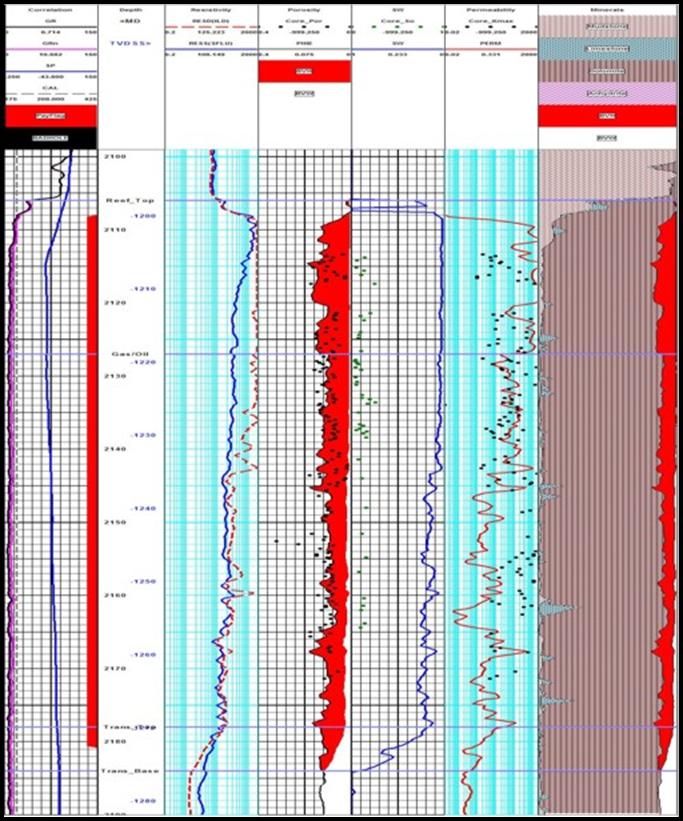
The extra high resistivity from 2108 to 2115 meters is a gas cap, which probably extends down to 2130 meters. Since production rates are severely penalized by government regulations when GOR is too high, this interval cannot be completed, leaving only a short interval between 2138 and 2174 meters available for production – about half the “net pay” interval. Completing too close to the water contact is also unwise, further restricting the completion interval.
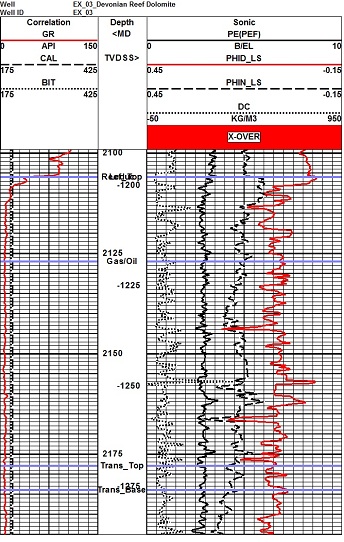
The PE curve indicates clean dolomite, while the
density neutron shows little separation for dolomite in the gas
zone at the top. The raw logs indicate limestone with 8 %
porosity when the zone is really dolomite with 10 – 12%
porosity. This is caused by gas effect canceling the dolomite
effect. Porosity must be computed from the special "Gas in Heavy
Minerals" algorithm over this interval or the results will be
far too pessimistic. Many computer aided log analysis programs
cannot do this without some help from you. Beware of
underestimating porosity in the “Gas in Dolomite” environment.
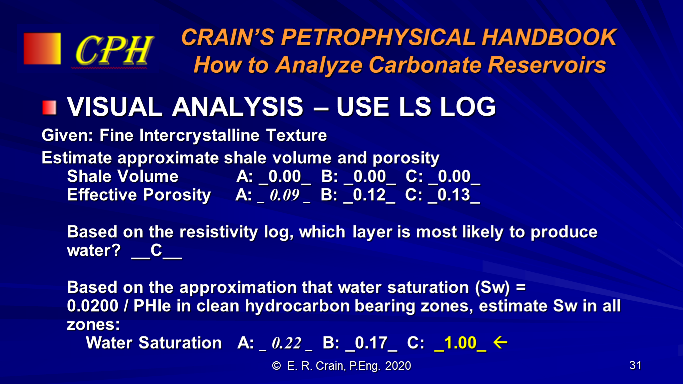
Although visual observation would provide good porosity values
in the oil and water zones, it is completely inadequate in the
gas and solvent zones.
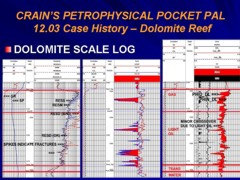
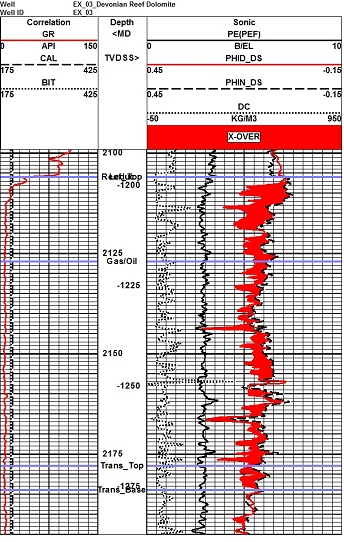
A depth plot of the density neutron log on a dolomite scale helps point this out by creating the gas cross over effect. Beware of dolomite scales in a limestone rock – the crossover on the density neutron DOES NOT indicate gas in this situation. Some very expensive mistakes have been made by inappropriate use of dolomite scale logs.
There is also a small amount of crossover on the dolomite scale log in the oil zone caused by the light gravity crude. Notice that there is no crossover in the water zone, demonstrating that the dolomite scaling is correct.
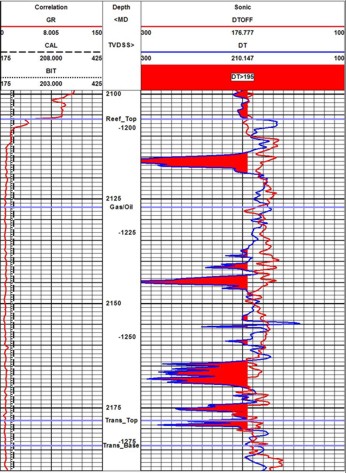
Although not shown on any of the depth plots, the porosity from the sonic log would be very optimistic in some levels, caused by cycle skipping in fractured rock. In other levels, the porosity would be several percent too low due to the sonic's inability to see all vuggy porosity. These observations indicate how difficult it is to analyze older carbonate wells where the sonic may be the only porosity log.
Fractures are indicated by skips on the sonic log and spikes on the density log, as well as low resistivity spikes on both the deep and shallow resistivity curves. These are also the most likely places for water break through. The lithology crossplots show the effect of vugs, fractures, and gas on the sonic log, as well as confirm the dolomite lithology. Some of the density spikes caused by hole breakout at fractures still show up on the final results. These could have been edited to reflect reservoir conditions instead of borehole effects.
Below are the well history and core data for this well. A
detailed match to porosity from core is usually not possible due
to heterogeneity of the reservoir and the difference in rock
volume seen by logs compared to the core. A good match to
average porosity and total pore volume can be achieved by
adjusting the target matrix density in the computer program. A
permeability match may be possible if pore geometry is uniform
throughout the interval. Heterogeneity, fractures, and vuggy
porosity usually prevent a reasonable permeability from log
analysis.
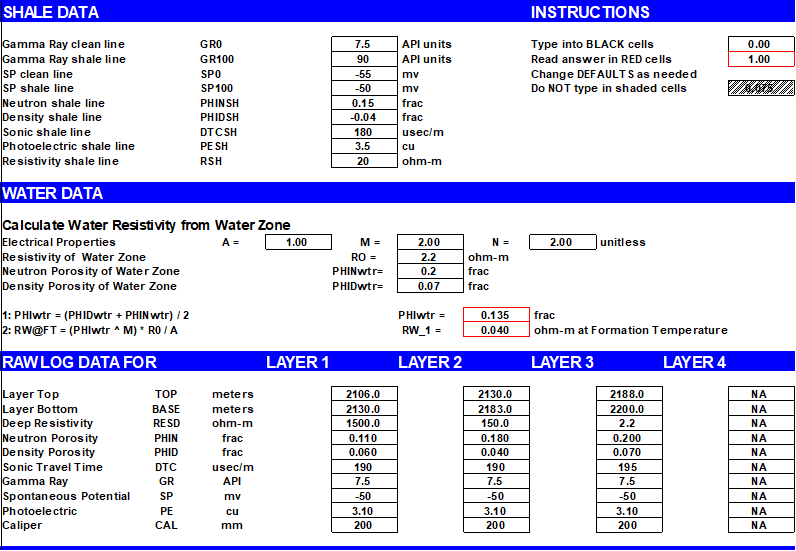
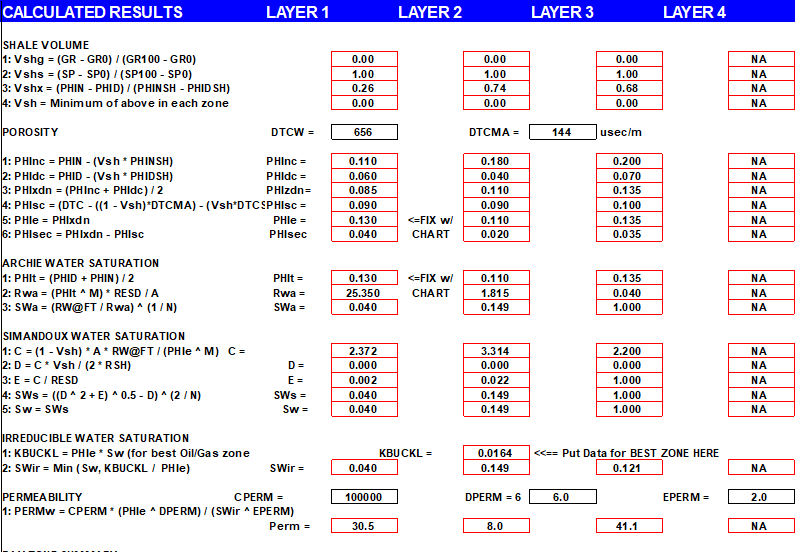
The best tool for quicklook log analysis is a spreadsheet.
Pick parameters and log data from the raw logs shown above. When
data entry is complete, the answers are instantly available.
META/KWIK data and results for Exercise 3
Fossil Joffre 15-22-39-26W4 Twin Well in 10-22-39-26W4 KB Elev: 908.1 m Logs: DIL-SP, FDC-CNL-GR, BHCS-GR, GR (COMPL) Log depths in METERS
DST #1 2120.0 – 2130.0 m Inflate Straddle VO: 1.0/2.0 SI: 28.0/27.0 min FP: 6550.0/6223.0 kPa SIP: 16410.0/16410.0 kPa HP: 23718.0/23063.0 kPa High permeability; No formation damage; Blow description: none given, closed chamber. Recovery: 188m clean condensate 192m mud.
Perf #1 / Acid Squeeze 2138.5 – 2145.0, 2150.0 – 2155.0, 2158.0 – 2161.6 m Prod Test 2138.5 – 2161.6 m VO: 24.0/24.0 No Shut In, No Pressures Recovery: 447.2 m3 clean uncontaminated oil
Perf #2 2107.5 – 2111.0 m Swab Test Recovery: 5.7 m3 Unknown recovery, Perfs Ineffective???
Perf #3 2121.0 – 2125.0 m Production Test No Pressures Recovery: 13.5 m3 Unknown recovery; Gas 67 600 m3/d (2.387 mmcf/d)
Perf #4 2171.5 – 2176.5, 2178.0 – 2179.0 Production Test No Pressures Gas 9600 m3/d (0.339 mmcf/d)
Perf #5 2166.0 – 2170.0 m Production Test No Pressures “not set”
Perf #6 2166.0 – 2174.6 m Production Test No Pressures Recovery: 52.6 m3 clean uncontaminated oil
NOTE: Bridge plugs between these tests were not reported. Well history listing for Carbonate Reef Example,
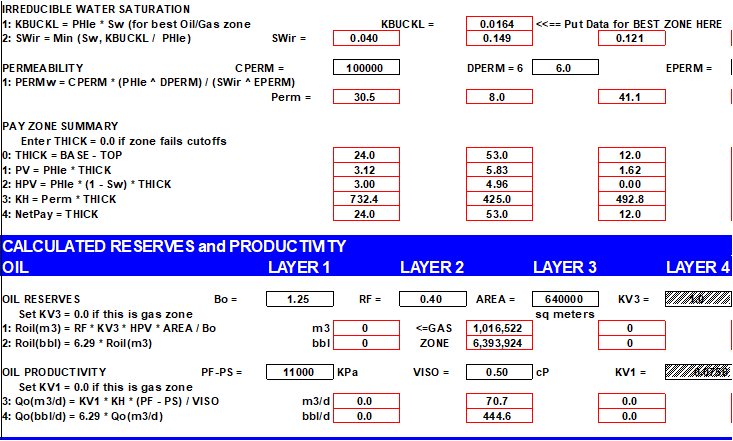
Log analysis production predictions in carbonates are difficult, and may be impossible, as in this case.
Core data listing for Carbonate Reef Example – partial listing over gas-oil contact
On the core porosity versus permeability plot, the data scatter is large due to natural fractures. The high porosity – low perm data points represent matrix permeability. The lower porosity – high perm points indicate the fracture permeability.
A solvent flood
was begun after Year 3 to maintain pressure in the twin well,
then production was resumed during Year 6. IPR was 2100 bbl/day
but declined very steeply and continued to decline on the same
trend after the solvent flood was terminated. We also need the
production graph for the twin well to see the overall
performance. |
|
|||||||||||||||||||||||||||||||||||||||||||||||||||||||||||||||||||||||||||||||||||||||||||||||||||||||||||||||||||||||||||||||||||||||||||||||||||||||||||||||||||||||||||||||||||||||||||||||||||||||||||||||||||||||||||||||||||||||||||||||||||||||||||||||||||||||||||||||||||||||||||||||||||||||||||||||||||||||||||||||||||||||||||||||||||||||||||||||||||||||||||||||||||||||||||||||||||||||||||||||||||||||||||||||||||||||||||||||||||||||||||||||||||||||||||||||||||||||||||||||||||||||||||||||||||||||||||||
|
Page Views ---- Since 01 Jan 2015
Copyright 2023 by Accessible Petrophysics Ltd. CPH Logo, "CPH", "CPH Gold Member", "CPH Platinum Member", "Crain's Rules", "Meta/Log", "Computer-Ready-Math", "Petro/Fusion Scripts" are Trademarks of the Author |
||||||||||||||||||||||||||||||||||||||||||||||||||||||||||||||||||||||||||||||||||||||||||||||||||||||||||||||||||||||||||||||||||||||||||||||||||||||||||||||||||||||||||||||||||||||||||||||||||||||||||||||||||||||||||||||||||||||||||||||||||||||||||||||||||||||||||||||||||||||||||||||||||||||||||||||||||||||||||||||||||||||||||||||||||||||||||||||||||||||||||||||||||||||||||||||||||||||||||||||||||||||||||||||||||||||||||||||||||||||||||||||||||||||||||||||||||||||||||||||||||||||||||||||||||||||||||||||

|
||
| Site Navigation | CASE HISTORY DOLOMITE REEF GAS OIL WATER | Quick Links |